dsh-driftwatch
edge-echo/dsh-driftwatch
Berichte über Verhaltensdrift in DSH-Sessions: vergleicht zwei Session-Logs und meldet Übereinstimmung der Tool-Sequenz, Tool-Mix, Reasoning-Umfang, Timing, Wiederholungen und Dateiziele, mit optionalem CI-Schwellenwert-Gate. Keine Abhängigkeiten.
Installation
dsh plugin --profile web add github:edge-echo/dsh-driftwatchREADME
dsh-driftwatch
Part of the dsh-toolkit family: dsh-mcp-bridge · dsh-win-toolkit · dsh-netassist · dsh-driftwatch · mcp-netassist · dsh-ledger


Behavior-drift reports for DeepSeek Harness agents.
You changed a prompt, a plugin, or a model. Something feels different. But what changed — and by how much?
DriftWatch reads two session logs and tells you exactly how the agent's behavior diverged: tool-call sequence, tool mix, file targets, reasoning volume, retries, timing. Zero dependencies. CI-ready.
中文文档见 README.zh.md。
The problem
DSH logs everything (Model-visible means logged), so the evidence already exists — but reading a 59 MB trajectory by hand is not a workflow. Existing tools solve adjacent problems:
| Tool | Answers |
|---|---|
dsh-replay | "show me this trajectory" (debugging) |
dsh-eval-harness | "does this match my written expectations?" (assertions) |
dsh-session-snapshot | "record this session so tests can rely on it" (fixtures) |
dsh-windtunnel | "replay the pipeline with a scripted model" (deterministic contracts) |
dsh-driftwatch | "how does this run differ from that run?" (comparison) |
dsh-replay diffs trajectories for debugging; dsh-eval-harness gates on assertions written in
advance. Neither answers the question in between: this run took a different path — is that a
problem? DriftWatch deliberately does not assert and does not render trajectories. It
produces a drift report: a structured, reviewable statement of behavioral change, plus an
optional threshold gate for CI.
What it looks like
Quick start
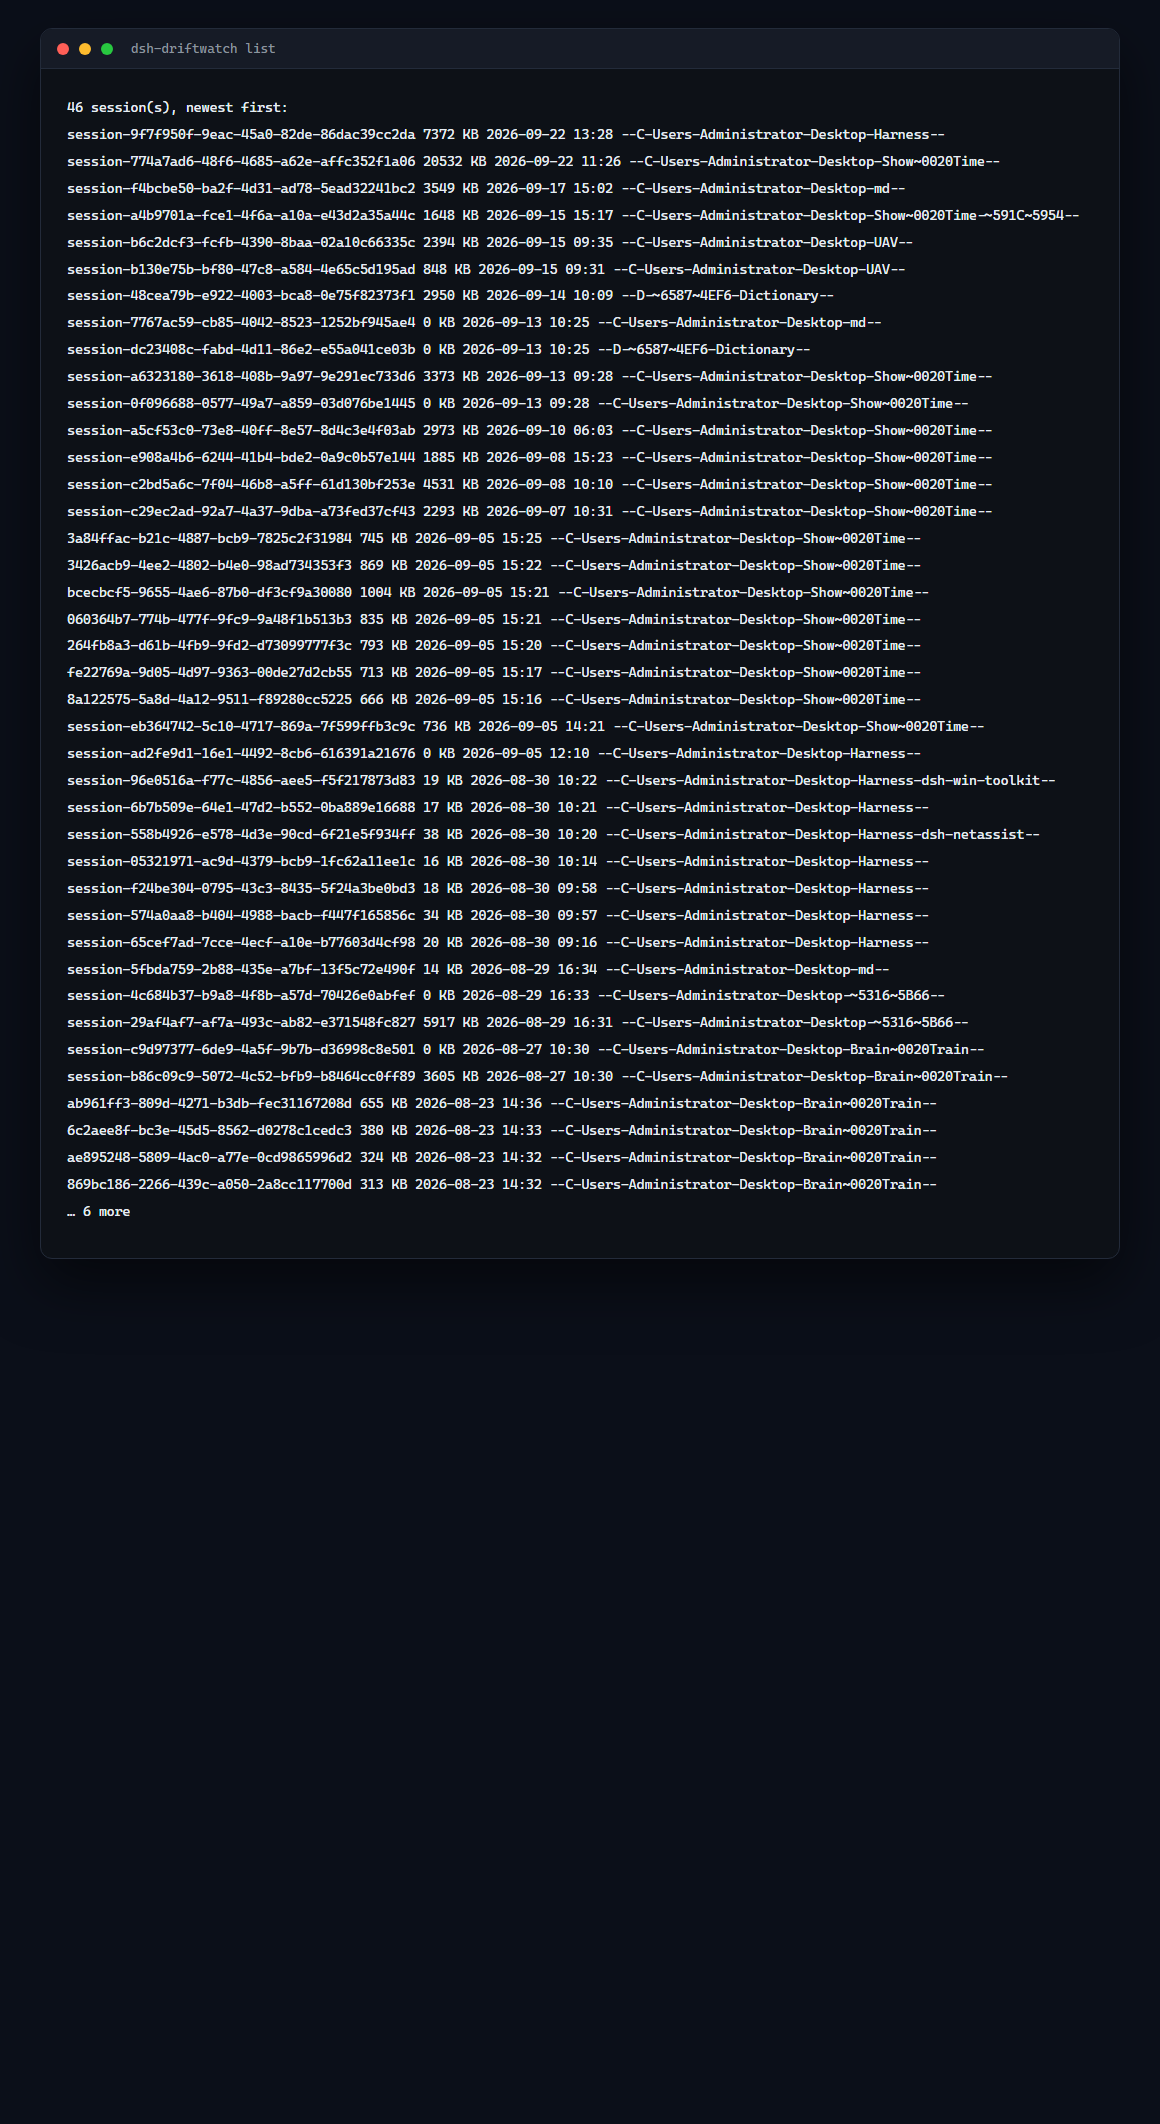
# list sessions under $DSH_HOME/sessions
npx dsh-driftwatch list

# compare two runs (id, id prefix, or path)
npx dsh-driftwatch compare session-b6c2dcf3 session-b130e75b

# CI gate: fail when drift reaches 35/100
npx dsh-driftwatch compare before after --fail-on-drift 35 --markdown drift.md
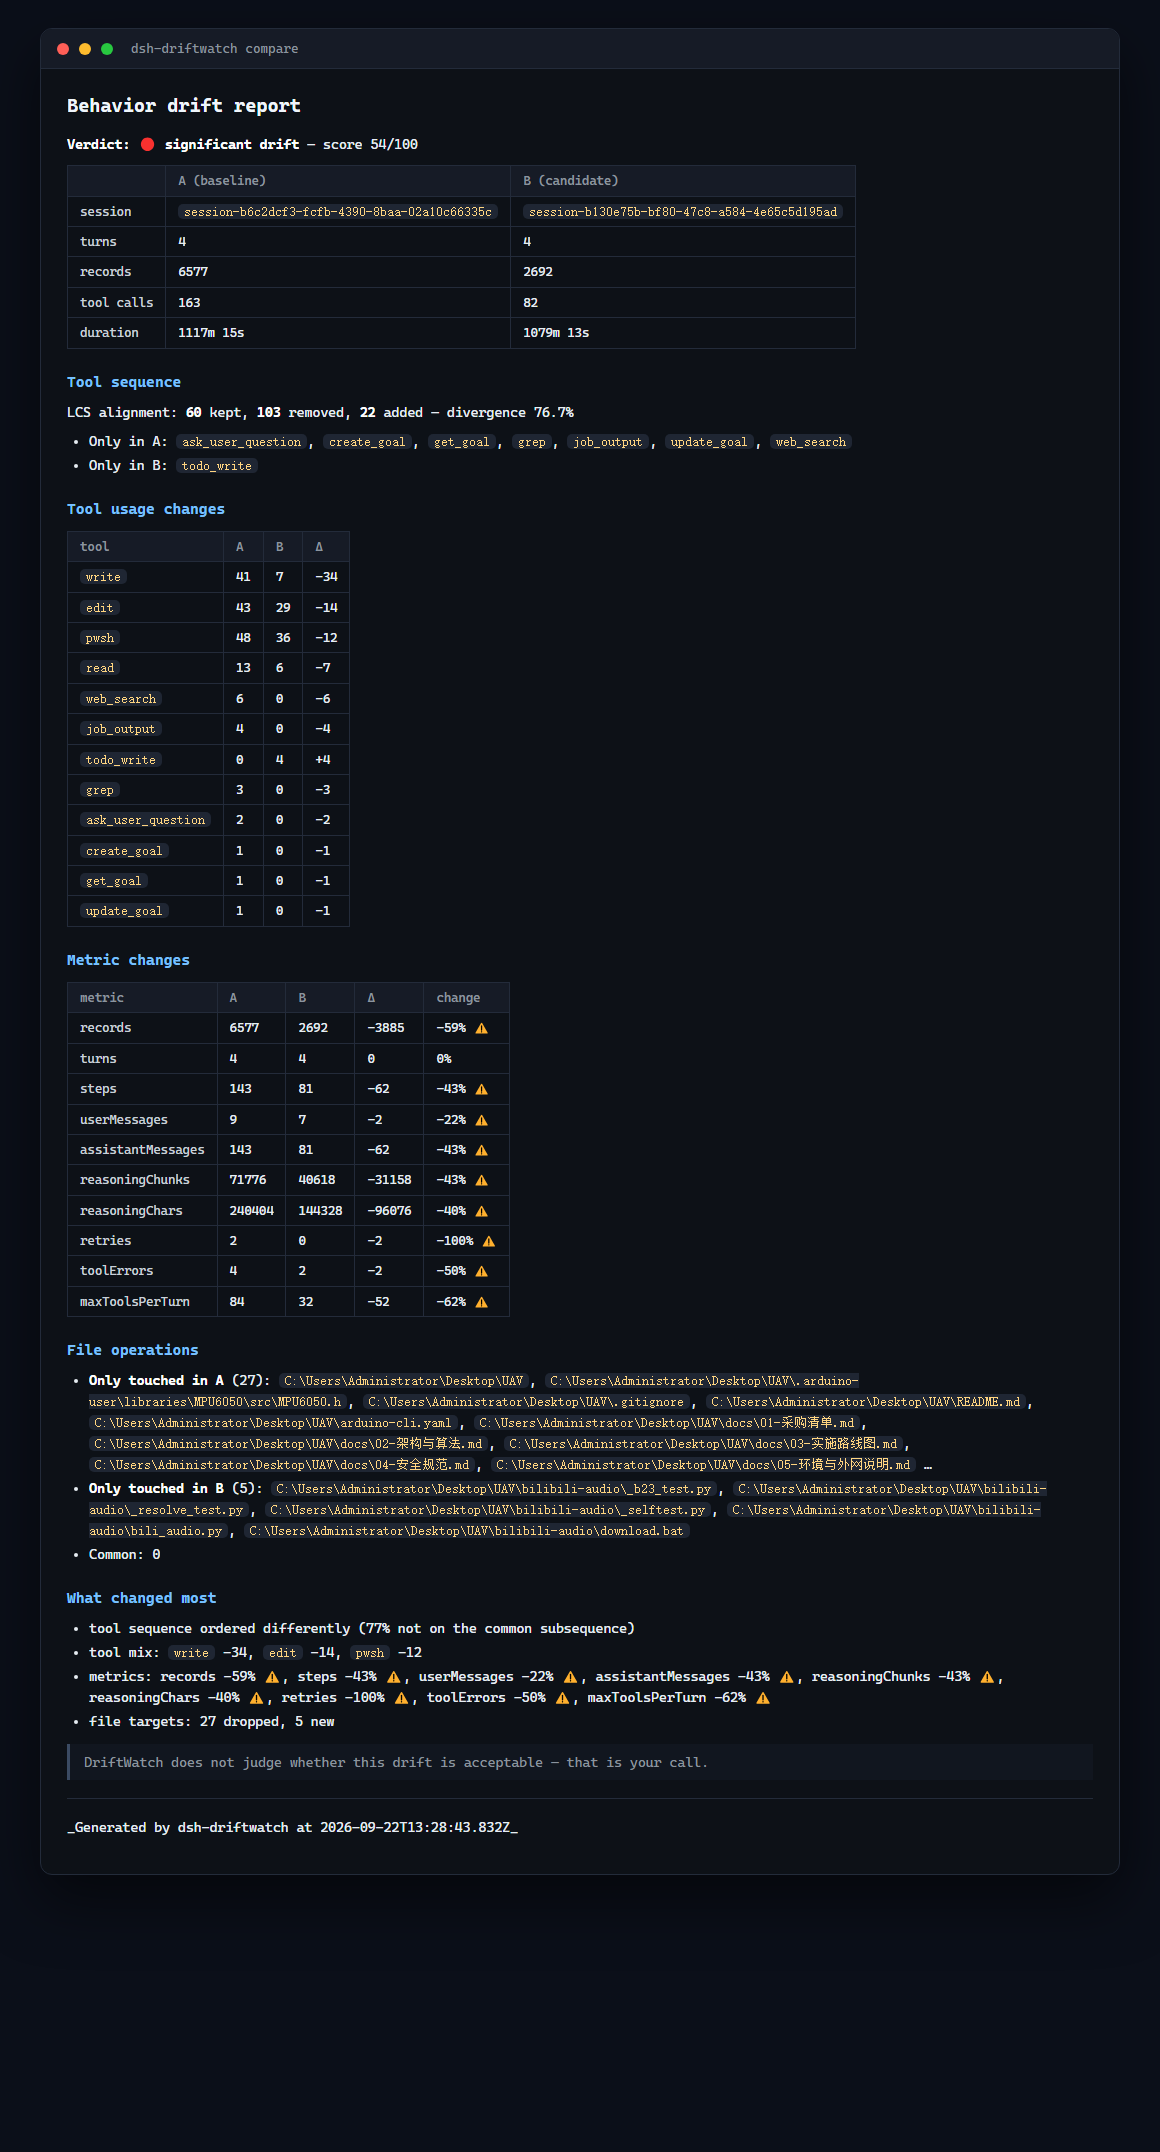
Real output from two actual runs:
**Verdict: 🔴 significant drift** — score 54/100

| | A (baseline) | B (candidate) |
|---|---|---|
| turns | 4 | 4 |
| records | 6577 | 2692 |
| tool calls | 163 | 82 |
| duration | 1117m 15s | 1079m 13s |

## Tool usage changes
| tool | A | B | Δ |
|---|---:|---:|---:|
| `write` | 41 | 7 | -34 |
| `edit` | 43 | 29 | -14 |
| `pwsh` | 48 | 36 | -12 |
| `todo_write` | 0 | 4 | +4 |
What it measures
| Signal | Detail | Weight |
|---|---|---|
| Tool sequence | LCS alignment: kept / removed / added, divergence % | 40% |
| Tool mix | per-tool count deltas across both runs | 25% |
| Metrics | records, turns, steps, messages, reasoning chunks/chars, compactions, retries, tool errors, max tools per turn | 20% |
| File targets | paths touched in only A / only B / both | 15% |
Those weights combine into a 0–100 drift score with three tiers: stable (<10), moderate (10–34), significant (≥35).
DriftWatch never decides whether drift is acceptable — that judgment stays with you. The score and thresholds are just a way to make the change visible.
CI integration
# .github/workflows/drift.yml
- name: Behavior drift check
  run: |
    npx dsh-driftwatch compare "$BASELINE_SESSION" "$CANDIDATE_SESSION" \
      --fail-on-drift 35 --markdown drift-report.md
- uses: actions/upload-artifact@v4
  if: always()
  with:
    name: drift-report
    path: drift-report.md
--json emits the full machine-readable report (scores, deltas, file sets) for dashboards or PR bots.
As a dsh plugin
Installing it into a profile also gives the agent two tools:
dsh plugin --profile web add dsh-driftwatch
| Tool | What the agent can do |
|---|---|
drift_compare | compare two sessions and report the drift inline |
drift_list | list available sessions to pick a baseline |
Useful for "compare how you did this task this time vs last time" — the agent gathers its own evidence.
How the session log is read
DSH session logs are append-only .jsonl.zstd: every append is a separate zstd frame, so a log is a concatenation of frames. Node's zlib decodes only the first frame and its stream API rejects the rest; DSH itself relies on a private zstd handle plus a koffi FFI fallback.
DriftWatch builds on @edge-echo/dsh-ledger, which parses the zstd frame structure (RFC 8878) instead of decompressing: 34,729 frames are located in 27 ms, without decoding a byte, and boundaries are exact rather than recovered by retrying.
The frame walk used to live here as a magic-scan heuristic, so the same subtle format was implemented twice. It now lives in one place, and the swap was checked rather than assumed: over a frozen 20 MiB log the old and new decoders produce the identical 62,037,223-character payload and the same 53,671 records. The structural walk costs about 17% more CPU in this path (overall time is dominated by zstd decoding, not by finding boundaries) — the win is exactness and one implementation, not throughput.
That is the project's only runtime dependency, and it is itself dependency-free: no third-party runtime code ships in either package.
Limitations
- Session-log record types are read defensively: unknown types are ignored, missing fields are tolerated. A future format change degrades the report rather than crashing it.
- Sequence alignment is exact (LCS) up to 4 M cell pairs; beyond that it falls back to multiset overlap and says so in the report.
- DriftWatch compares behavior, not correctness. A stable run can be wrong; a drifting run can be better.
License
MIT
Ähnliche Plugins
dsh-web-ui (dsh-chat-recovery)
zhu1090093659/dsh-web-ui
dsh-synapse
liangmianya/dsh-synapse
billion-context
ranxianglei/billion-context
dsh-chat-import
nwflower/dsh-chat-import