dsh-status-bar
starlight-bananice/dsh-status-bar
Una barra de estado de sesión configurable de 17 segmentos para el dock del compositor de dsh, con TPS en vivo, estimación de costos por modelo y un diálogo de uso y costos.
Instalar
dsh plugin --profile web add github:starlight-bananice/dsh-status-barREADME
dsh-status-bar · Know what your agent is doing — at a glance
✅ Adapted to the DSH desktop app — DSH
0.2.0-rc.2. The0.2.xline is built for the desktop runtime: install it into thedesktopprofile (in-app Plugins page, ordsh plugin --profile desktop add …). The retired0.1.xline targets the old0.1.xruntime and will NOT load on the 0.2.0 desktop.





Overview
The problem: the native DSH bottom status bar is one long, fixed line — the more it shows, the more it overflows, and on narrow windows parts of it get truncated. You cannot see the current model, how full the context window is, how fast tokens are streaming, or what a session has cost — and there is no way to arrange that information the way you work.
Who it is for: anyone running the DSH desktop app daily — power users and teams who want live session telemetry without leaving the composer, and without running a separate monitor.
What it does:
- Desktop-native, not bolted on — rebuilt against the DSH 0.2.0 desktop runtime (
@deepseek-ai/dsh-*@0.2.0-rc.2): session facts come from the desktop's own Chat / session / composer services, background jobs from its job service, and the live throughput figure from its own streaming event window. No shims, no legacy compatibility path. - Near-native experience, fully yours — 16 toggleable, reorderable segments: status dot, model, title, workspace, turns & steps, model/tool time, TTFT & decode speed, cache-hit rate, tokens, context pressure, live TPS, session time, cost estimate, jobs, queue, errors
- Live throughput (TPS) — the bar folds this session's own live stream in the browser, so the speed updates chunk by chunk while streaming and tracks the real generation rate regardless of how finely the stream is delivered; no polling, no host round-trip, no external live-stats plugin
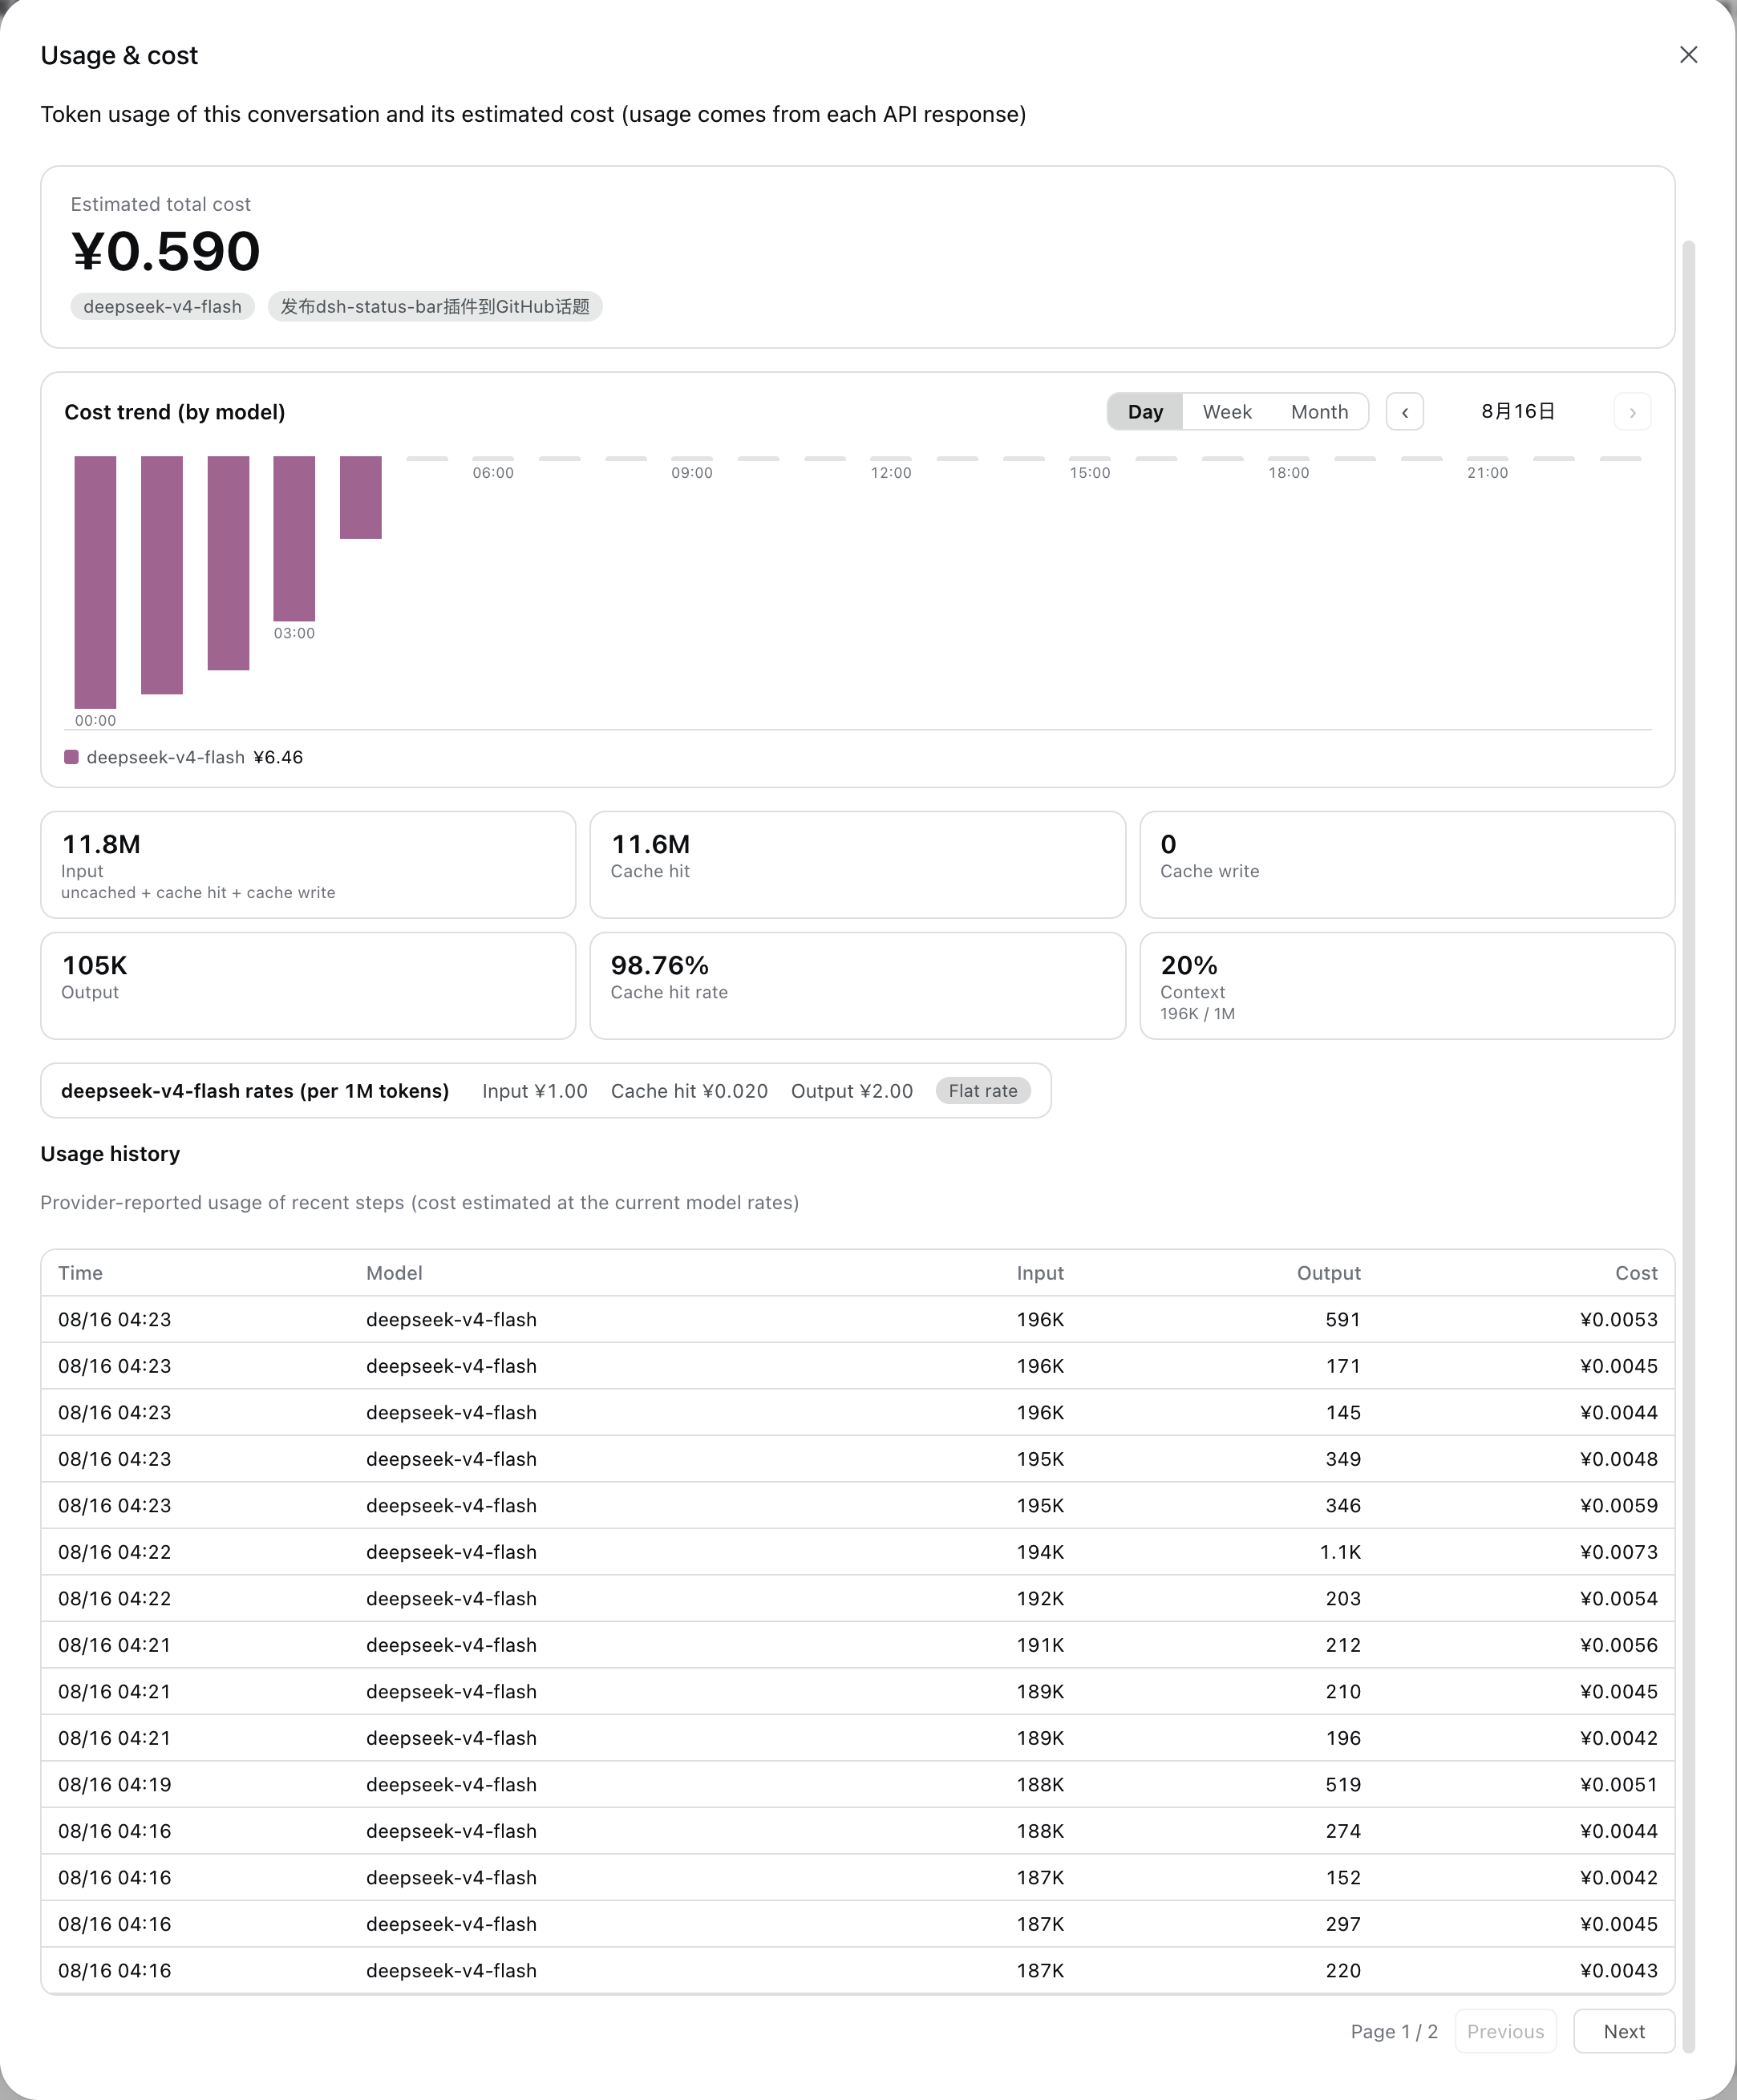
- Cost estimation with a user-maintained model price book — per-model rates, per-model peak/off-peak schedules, each message/step priced with the model that actually produced it (input, cache-hit, cache-write and output priced separately at that step's own time), and a «Usage & cost» dialog with a stacked cost-trend chart (day / week / month), a paged per-step usage history (with a dedicated cache-hit column), and a total-cost hero
- Keeps up with DeepSeek's shifting peak/off-peak rules — no more one hard-coded list of
HH:MMwindows: billing keys off working day vs weekend vs public holiday, with the holiday / 调休 calendar fetched and cached locally (and editable by hand). When DeepSeek moves the windows, changes the weekend rule, or adds holidays and make-up workdays, you refresh once or edit one field instead of rebuilding the price book - Zero-config default — 13 segments ship enabled; everything else is a checkbox away
- Useful options — multi-line wrapping (so nothing gets truncated), per-model cost estimation with peak/off-peak pricing, currency choice (CNY / USD), a quick-toggle gear menu, and a dedicated settings page with one-click reset
- 24-hour clock fields — peak windows are typed as
09:00, not whatever AM/PM format the browser locale would impose on a native time input - Clean takeover — the plugin's bar shadows the built-in
statscell at lower priority: while loaded it renders, when unloaded the built-in line returns untouched - Bilingual UI — client locale strings ship for English and Chinese, following the DSH locale system
Screenshots
The status bar replaces the built-in stats line with near-native live session telemetry (status · model · turns · context · cache · TPS · session time · jobs · queue · errors), managed from a dedicated settings page — including a per-model price book and the holiday calendar behind peak/off-peak pricing:

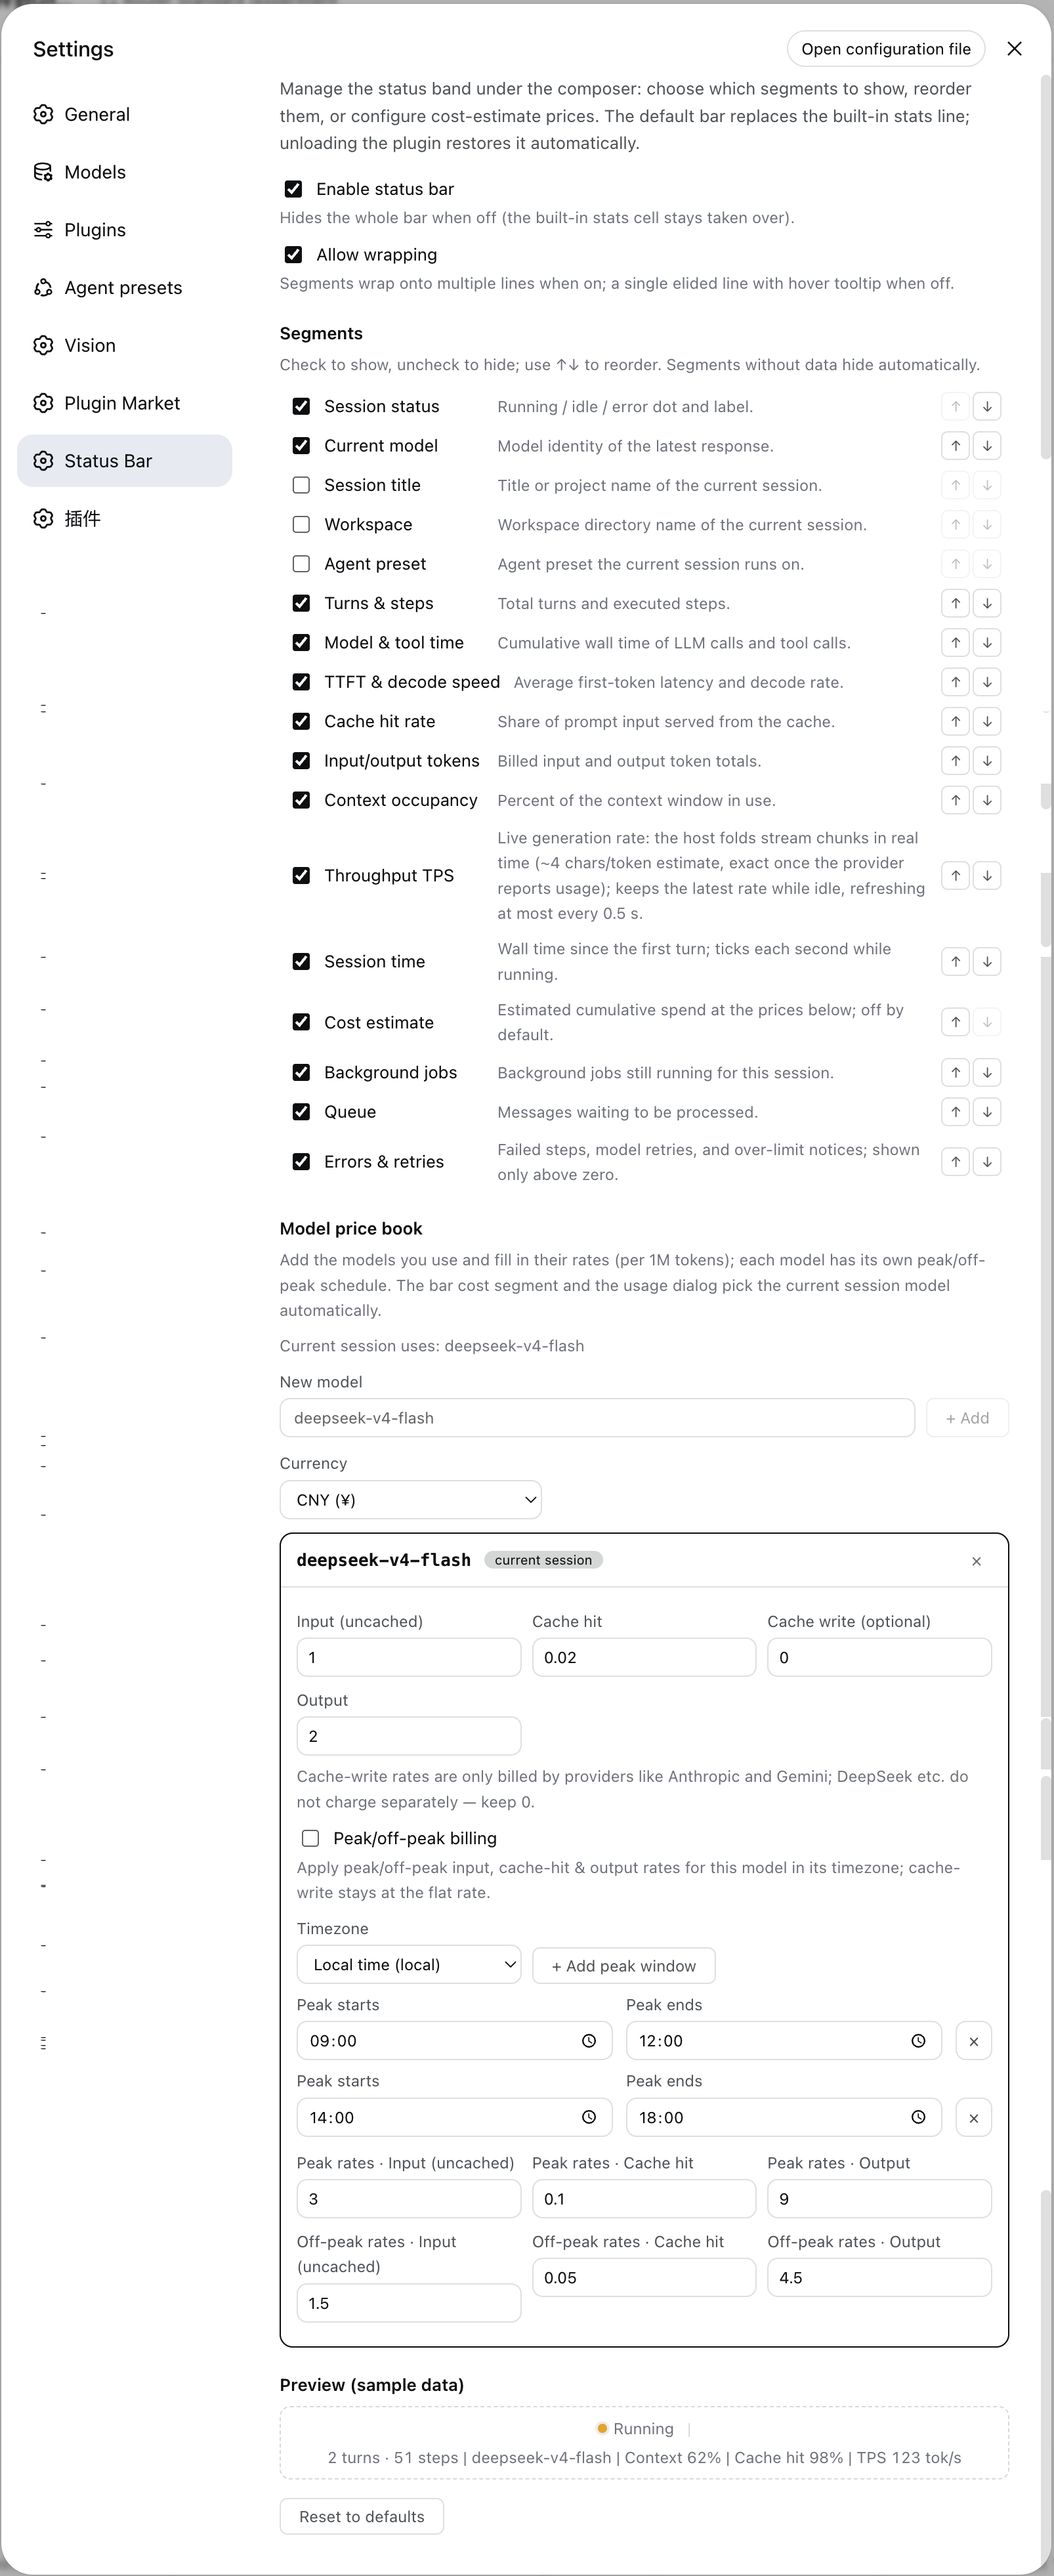
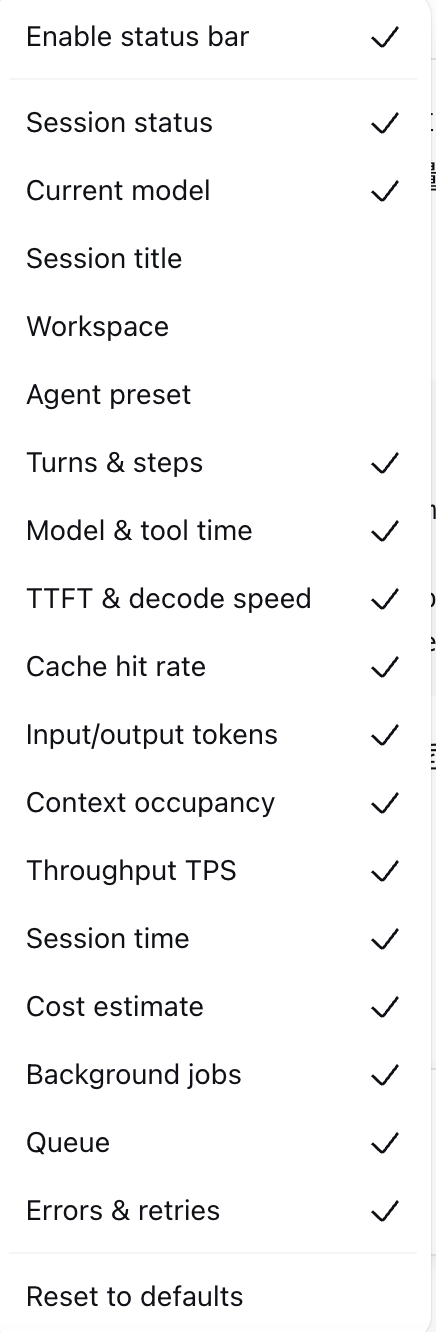
| Toggle & reorder on the go (segment list) | Usage & cost dialog (trend chart · stat cards · history) |
|---|---|
 |  |
Compatibility
| Item | Value |
|---|---|
| DSH desktop app | 0.2.0-rc.2 — the target of this line; verified 2026-10-01 |
| Plugin line | 0.2.x for the desktop runtime. 0.1.x targets the retired 0.1.x runtime and will not load on the 0.2.0 desktop. |
| DSH profile | desktop for the packaged app · web for a self-hosted dsh web · headless for the CLI runtime |
| Runtime | Node ≥ 22 (host) + modern browser (client); no external services |
| Peer relation | Independent of every other status/TPS plugin: the live rate is folded client-side from this session's own event window, so this plugin registers no shared projection key — no peer's key, stateVersion, or registration order can displace the bar's TPS |
What the desktop port changed (0.2.0)
DSH 0.2.0 removed @deepseek-ai/dsh-client-runtime and split what the old Conversation snapshot carried. This line ports the plugin to that shape:
- Session data moved. Nodes, turn timings, the streaming partial and running tool calls now come from the Chat target (
useChat), lifecycle facts (running,lastAgentError) from the session snapshot (useSession), and the queued-message count from the composer inbox (useInput). - Jobs came from a removed field.
SessionListState.jobsBySessionis gone; the jobs segment now reads the client job roster (ctx.jobs), the same source as the desktop's own session-header job list. - Live TPS moved into the browser. 0.2.0 has no durable
assistant/chunkevent, so the host projection that used to serve the rate no longer receives input. The bar folds the session's own live stream client-side instead — same estimator, and a trailing-window rate measurement that no longer depends on how finely the stream is delivered. - The
agent presetsegment was retired (SessionSummary.agentPresetno longer exists; 0.2.0 exposes the preset only to the new-session hero chip). It was off by default, and any saved configuration that still lists it is filtered out on load. - Build no longer needs a DSH source checkout. The DSH packages the plugin compiles against are pinned devDependencies at
0.2.0-rc.2;pnpm install && pnpm run buildis the whole story.
Install
Every install path below targets one DSH profile. The packaged desktop app runs the profile named desktop; a self-hosted dsh web normally runs web.
Desktop app — in-app (easiest)
- Open the Plugins page in the left sidebar.
- Click Add plugin, enter the package name
@bananiceee/dsh-status-bar, and confirm with Install. - Click Enable now when the install finishes.
- If the dialog says the change takes effect on the next launch, restart the app.
Installing from inside the app writes to the same profile a terminal command would, so the two paths below are interchangeable.
Desktop app — from a terminal
# latest release of the desktop line
dsh plugin --profile desktop add @bananiceee/dsh-status-bar

# or pin the exact version
dsh plugin --profile desktop add @bananiceee/dsh-status-bar@0.3.0
Self-hosted Web / CLI
dsh plugin --profile web add @bananiceee/dsh-status-bar@0.3.0
Other sources
# A local checkout (profile assembly)
dsh plugin --profile desktop add ../dsh-status-bar

# The GitHub repository
dsh plugin --profile desktop add github:Starlight-bananice/dsh-status-bar

# A pinned release tarball — immutable and versioned (attached to every
# GitHub release; handy when git access to the repo is awkward)
dsh plugin --profile desktop add https://github.com/Starlight-bananice/dsh-status-bar/releases/download/v0.3.0/bananiceee-dsh-status-bar-0.3.0.tgz
Note: pnpm 11 enforces a 24 h
minimumReleaseAgefor freshly published packages — if a same-day release is rejected, append--config.minimumReleaseAge=0to thedsh plugin addcommand.
Note: pnpm fetches GitHub-hosted packages from
codeload.github.comand does not read your git proxy config. If the install hangs or fails with a network error (e.g.error (23)), export an HTTP(S) proxy:export HTTPS_PROXY=http://127.0.0.1:7890 HTTP_PROXY=http://127.0.0.1:7890and re-run.
Since v0.1.5: the built
lib/artifacts are committed to the repository — a git install is ready to run immediately, no build step required. Add the plugin, restart the app, done.
Upgrade
# npm installs: update straight to the latest registry version
dsh plugin --profile desktop update @bananiceee/dsh-status-bar

# or re-add a pinned version (the in-app page currently has no auto-update:
# uninstall, then install the new version)
dsh plugin --profile desktop add @bananiceee/dsh-status-bar@0.3.0

# github: installs — pnpm pins a ref-less `github:` dependency to the commit
# resolved at install time, so `dsh plugin update github:...` reports
# "Already up to date" and keeps the old build. Upgrade with a re-add:
dsh plugin --profile desktop remove @bananiceee/dsh-status-bar
dsh plugin --profile desktop add github:Starlight-bananice/dsh-status-bar#v0.3.0
Disable
- Hide the bar only — the client master switch (Settings → Status Bar, or the gear menu in the composer) turns the bar off instantly; the host projections and the usage ledger keep running.
- Stop the plugin entirely — disable it on the in-app Plugins page (or remove it from the profile's
bundleslist); re-enabling restores it.
Uninstall
dsh plugin --profile desktop remove @bananiceee/dsh-status-bar
Removal restores the built-in stats line automatically (the shadow cell is released). Data left behind: browser localStorage (dsh.statusBar.v1) and the host usage file (see Permissions & data) are not deleted — remove them manually for a clean slate.
Quick start
-
Install (above) and restart the app if the installer asks for it.
-
Start a session — the bar shows status · model · turns · durations · speeds · cache hit · tokens · context · TPS · session time · jobs · queue · errors by default.
-
Open Settings → Status Bar (its own section in the Settings nav, labeled
Status Bar) to toggle/reorder segments, enable wrapping, or reset. -
Want cost estimates? Add the models you use to the model price book:
# In Settings → Status Bar → Model price book:
# model "deepseek-flash" → peak input 2 / cache hit 0.04 / output 8 (CNY per 1M tokens)
# then hit "Apply DeepSeek official rules": peak = 09:00–12:00 and 14:00–18:00 Beijing time on
# Mon–Fri; everything else (weekends, holidays, 调休 rest days in full) is off-peak at half price
The bar then shows e.g.
≈¥0.0123for the current session; the figure is the sum of each model's usage × that model's own price (so switching models mid-session prices each part with its own rate). Click the chart button next to the gear to open the usage & cost dialog (stat cards, rate card, a paged usage history — 20 rows per page, up to 10 pages — with input / cache-hit / output / cost columns, and a per-model cost-trend chart with ‹ › period navigation).
Configuration
All configuration is client-side, stored in browser localStorage under dsh.statusBar.v1, edited via the settings page or the in-composer gear menu.
| Option | Default | Meaning |
|---|---|---|
enabled | true | Master switch; false hides the bar entirely |
wrap | true | Allow the bar to wrap onto multiple lines within the input card's width instead of eliding (the bar never runs past the input box's edges in either mode) |
segments | 13 on / 3 off (see below) | Ordered list of enabled segments |
cost.currency | CNY | Currency for cost display (CNY / USD) |
cost.models | {} | User-maintained model price book (model id → prices + schedule) |
calendar.dayRules | true | Split peak/off-peak by working day vs weekend/holiday; off = clock windows only (the old behavior) |
calendar.autoFetch | true | Fetch and cache the holiday calendar through the plugin host route |
calendar.overrides | [] | Manual exception dates ({date, kind: off/work/auto, label}); they win over the published calendar |
Default segment state: on — status, model, counts, durations, speeds, cache hit, tokens, context, TPS, session time, jobs, queue, errors; off — title, workspace, cost.
Model price book entry (defaults filled in when a model is added — DeepSeek's current published rates per 1M tokens): peak input 2 / cache hit 0.04 / output 8, off-peak input 1 / cache hit 0.02 / output 4, cache write 0; peak/off-peak is on by default with timezone Asia/Shanghai (DeepSeek writes its schedule in Beijing time), peak windows 09:00–12:00 and 14:00–18:00 on working days, and weekends plus public holidays / 调休 rest days off-peak all day. Existing entries are never overwritten, but a v1 config is upgraded field by field: its windows keep their old all-days behavior and the weekend/holiday switches default to on — turn Split peak/off-peak by working day vs holiday off to keep the literal old behavior.
Holiday calendar: DeepSeek decides working days from Chinese statutory holidays and the State Council's 调休 (make-up workday) schedule, which is re-announced every year — so nothing is hard-coded. "Refresh calendar" asks the plugin's own host route /status-bar/api/holidays, which fetches the published dataset (holiday-cn, transcribed from the State Council notices) and caches it at <DSH_HOME>/dsh-status-bar/holidays.json. When the calendar (or a single year) is unavailable the pricing falls back to the weekday rule, the settings page says why, and you can add exception dates by hand.
Environment variables: DSH_HOME (host-side) — base directory for the plugin's local data (default ~/.dsh). No other env vars, no secrets, no tokens.
Segment reference (all 16, toggleable & reorderable):
| Segment | Shows | Source |
|---|---|---|
| Status | ● running / idle / error dot | session snapshot running / lastAgentError + chat partial / runningCalls |
| Model | model of the latest response | sessionModel projection (host fold of assistant/message events) |
| Title | session title (truncated) | SessionSummary.displayTitle |
| Workspace | workspace dir name | SessionSummary.cwd |
| Turns & steps | N turns · M steps | sessionStats projection (window-fold fallback) |
| Model & tool time | LLM · tool-call wall time | sessionStats |
| TTFT & decode | avg first token · tok/s | sessionStats |
| Cache hit | prompt cache-hit share (2 decimals, capped at 99.99%) | tokenUsage |
| Tokens | billed input/output totals | tokenUsage |
| Context | context-window occupancy % | contextPressure |
| Throughput TPS | live generation rate (default on) | client fold of the session event window (assistant/live-chunk); block-aware token estimation (~4 chars/token + block/role framing, re-priced at block-end), measured over a trailing 1.5 s window so the figure is independent of stream granularity; switches to the provider-reported rate once exact usage lands, and reports 0 while the session is not generating |
| Session time | wall clock, ticks while running | chat turnTimings |
| Cost estimate | ≈¥0.0123 (off by default) | sessionUsage projection — each model's usage × its own effective price, with the tier decided by the working-day/weekend/holiday rule at that step's own time, summed across models |
| Jobs | running background jobs | ctx.jobs roster (same source as the desktop's session-header job list) |
| Queue | queued messages | composer inbox (useInput → queue) |
| Errors | failed/retried/over-limit count (>0 only) | chat node fold |
Permissions & data
| Category | What the plugin touches |
|---|---|
| Files | Host writes the usage ledger to <DSH_HOME>/dsh-status-bar/usage.jsonl (~/.dsh/dsh-status-bar/usage.jsonl by default; one record per assistant message: timestamp, model, input/cacheRead/cacheWrite/output tokens). In-memory history is a rolling 120-day window. |
| Network | The client only calls the plugin's own local webserver routes (same origin as the DSH web UI, 127.0.0.1): /status-bar/api/usage for chart buckets and /status-bar/api/holidays for the holiday calendar. Only when you hit "Refresh calendar" (or the 12-hour cache goes stale) does the host issue one GET to the public dataset host cdn.jsdelivr.net (holiday-cn) to update it — turn "Fetch and cache the holiday calendar automatically" off for zero outbound traffic. |
| Credentials | None. The plugin never reads, stores, or transmits API keys, tokens, or cookies. |
| User data | Client: localStorage["dsh.statusBar.v1"] (bar config + price book + holiday exceptions) and localStorage["dsh.statusBar.holidays.v1"] (calendar cache) — no conversation content. Host: the usage ledger above (token counts only) plus the holidays.json calendar cache; no prompts, messages, or file contents. |
Troubleshooting
| Symptom | Cause & fix |
|---|---|
| The bar does not appear | Master switch off → enable it in Settings → Status Bar, or via the gear menu. localStorage cleared? Config resets to defaults. On a fresh install, restart the app once. |
| Nothing loads after upgrading from 0.1.x | Expected — the 0.1.x line cannot run on the 0.2.0 desktop. Uninstall it, then install 0.2.x into the desktop profile. |
| TPS segment is 0 / blank | No stream has started yet in this session, or the stream has settled (no active generation reads as 0 by design). The measurement window restarts on each retry. |
| TPS conflicts with another plugin | None by design — this plugin registers no shared projection key. The live rate is folded client-side from this session's own event window, so another status/TPS plugin cannot displace or shadow it. |
| Cost estimate missing | None of the session's models is in the price book (or they are all zero-priced) → add them in Settings → Status Bar → Model price book. Costs are estimated at the book's rates (per model, flat or peak/off-peak), not provider billing. |
| Cost reads too high / too low | Check the tier badge on the model (peak / off-peak and its reason): "outside peak windows" when it should be peak usually means a window typed in 12-hour form (this plugin parses 24-hour 09:00); a weekend/holiday judged wrong means the calendar is stale — hit "Refresh calendar" or add an exception date. |
| Holiday calendar fetch fails | The settings page shows the reason and pricing falls back to the weekday rule (weekends still off-peak, 调休 workdays billed off-peak). Retry later, add exception dates by hand, or turn automatic fetching off. |
| Usage chart is empty | No assistant messages with provider-reported usage in the period yet, or DSH_HOME points elsewhere than expected (check the usage.jsonl location above). |
| UI looks broken after an upgrade | Hard-refresh the window (stale client bundle) and verify the plugin version on the in-app Plugins page. |
| Can't tell which version is installed | From a terminal (macOS/Linux): node -p "require(process.env.HOME + '/.dsh/profiles/desktop/node_modules/@bananiceee/dsh-status-bar/package.json').version" — use web instead of desktop for a self-hosted web profile. |
Logs: the plugin writes no log files of its own — host-side diagnostics appear in the DSH host process output, client-side issues in the browser devtools console.
Rollback: the settings page has a one-click Reset (restores all defaults). For the plugin itself, uninstall → re-add the previous version with dsh plugin --profile desktop add <pkg>@<version>; the built-in stats line is always restored automatically on removal.
Development
pnpm install            # devDependencies: typescript / tsdown / react / @types AND the DSH packages this plugin compiles against (pinned @deepseek-ai/*@0.2.0-rc.2)
pnpm run build          # host tsc → lib/, client declarations → lib/types/client, tsdown → lib/client.js
pnpm run typecheck:client   # client typecheck only
pnpm run verify         # rebuild and fail if the committed lib/ drifted from src/
Build artifacts under lib/ are committed (since v0.1.5), so plain git installs work without any build step; the commands above exist to refresh the artifacts before a release. Nothing here needs a DeepSeek Harness source checkout any more: every @deepseek-ai/* package the plugin compiles against is a pinned devDependency, resolved from this package's own node_modules. Host-side sources are plain TypeScript (Cordis plugin), client sources are React + the DSH client UI slots.
Keeping lib/ in sync: run pnpm install --frozen-lockfile (reproducible rebuilds use the exact toolchain pinned in pnpm-lock.yaml), then pnpm run verify before pushing (scripts/verify.sh rebuilds host + client and fails when the committed lib/ drifted from src/). The repository also ships a pre-push hook that runs it automatically whenever a push touches src/ or the build config — enable it once with:
git config core.hooksPath .githooks
The lib-sync GitHub Actions workflow enforces the same invariant in CI: a fast artifact-integrity check on every push/PR, plus a full rebuild-vs-lib/ drift check on PRs that touch src/ and on manual dispatch.
Contributing: fork the repository, branch off main, and open a PR — small, focused changes with a clear description are preferred. Report bugs via Issues with the DSH version (desktop app version included), browser, and a minimal repro.
License & security
- License: MIT (© 2026 Starlight-bananice).
- Security: this plugin holds no credentials and makes no network calls; the attack surface is the DSH host process itself. To report a security issue privately, use GitHub's Security Advisories on this repository (https://github.com/Starlight-bananice/dsh-status-bar/security/advisories/new) — do not open a public issue for vulnerabilities.
Plugins relacionados
DeepSeek-Balance-Whale-Widget
meteornox/deepseek-balance-whale-widget
dsh-context
bowenliang123/dsh-context
dsh-cost-meter
han-1413141/dsh-cost-meter
dsh-damage-pulse
wssfk12138/dsh-damage-pulse