dsh-cap-profile
ansonfishing/dsh-cap-profile
Profilage des capacités par modèle pour DSH : transforme l'historique des sessions locales en tableaux de bord par modèle affichant le nombre de sessions, l'utilisation des outils, les taux d'erreur et les principales signatures d'erreur, avec des filtres par plage horaire et la comparaison multi-modèles.
Installer
dsh plugin --profile web add github:ansonfishing/dsh-cap-profileREADME
dsh-cap-profile
模型能力画像面板——DSH(DeepSeek Harness)插件。
为什么
会话跑得越多,越难回答「哪个模型在哪些事上稳、哪些事上老翻车」。翻原始日志太慢,人肉统计容易漏。
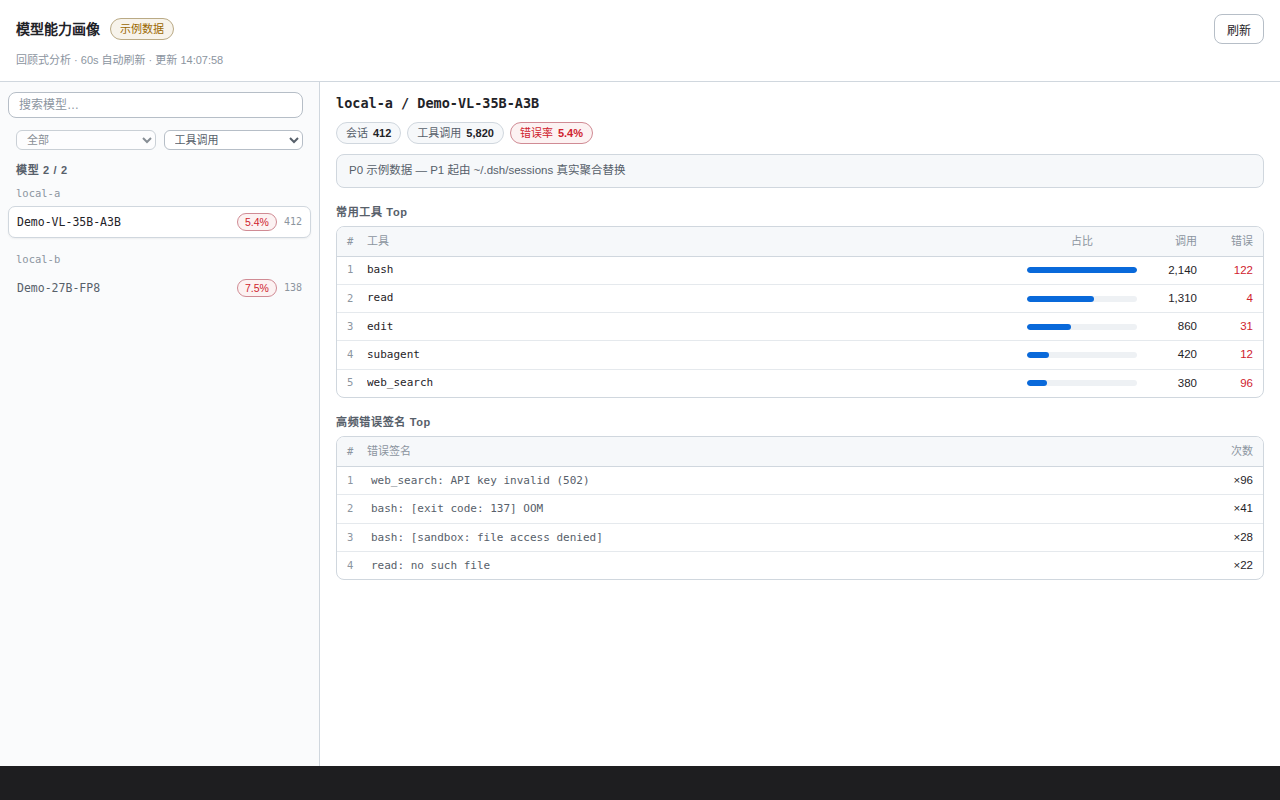
这个插件把 ~/.dsh/sessions 的会话历史做成画像,直接回答:每个模型的会话数、工具调用量、错误率、最爱用的工具和最高频的错误签名。
快速开始
前提:DSH(带 web)+ pnpm;Node ≥ 24(zstd 解码用 Node 内置 zstdDecompressSync)。
cd ~/.dsh/profiles/web                      # 你的 DSH web profile 目录
pnpm add github:Ansonfishing/dsh-cap-profile
然后在 package.json 的 dsh.profile.bundles 数组里加上 "dsh-cap-profile",重启 dsh。会话视图出现「能力画像」tab;首次打开触发后台首扫(大历史约 20s 级),期间先显示 mock 数据。
功能
- 模型对比表——每个模型(provider / model)的会话数、工具调用数、错误数、错误率。
- 工具 Top5 / 错误签名 Top5——每模型最常用工具(含 per-tool 错误率:0 灰 / <5% 琥珀 / ≥5% 红);归一化后的高频错误模式(如
bash: [exit code: 137] OOM),快速看出模型「易翻车」面。 - 多模型对比(≤4)——勾选多个模型进入对比视图:每模型一张卡片,卡内收敛指标对照(best/worst/top 标色)、工具 Top-10 矩阵、高频错误 Top-5、每日调用/错误趋势 mini 竖条(当日错误红色标注);有效勾选 <2 时自动回退单模型详情。
- 时间范围筛选——全部 / 近 7 / 近 30 / 近 90 天 / 今天 / 昨天(锚点 = 数据中最大日,对系统时钟漂移免疫)。
- 只读——只分析展示,从不修改会话数据;路由校验客户端头 + Origin/Referer,跨源请求 403。
- 增量缓存——per-file mtime 基线,后台 60s 增量 / 24h 全量;首扫未完成时路由不阻塞,回退上次缓存或 mock。
- 零运行时依赖——纯 Node.js。
不用装 DSH,先看看面板?
clone 本仓库,浏览器直接打开 test/harness/index.html——零依赖渲染 harness,?scenario=mock|live|empty|error 切换数据场景,?chrome=0 隐藏 harness 顶栏。
开发
npm test # node --test test/*.test.mjs
本地开发:clone 后在 profile 里用 pnpm add link:../path/to/dsh-cap-profile。客户端改动浏览器 F5 即可;Node 侧(index.js / lib/*.js)改动需重启 dsh。
许可证
MIT © Ansonfishing
Plugins associés
DeepSeek-Balance-Whale-Widget
meteornox/deepseek-balance-whale-widget
dsh-context
bowenliang123/dsh-context
dsh-cost-meter
han-1413141/dsh-cost-meter
TokenLedger
zh667/tokenledger