dsh-telemetry
duyanta123/dsh-telemetry
本地优先的 Harness 运行遥测插件:记录请求、模型、工具与插件生命周期指标(延迟、Token、成本、错误、缓存),默认不采集内容。Local-first Harness telemetry plugin for DeepSeek Harness. npm 包 dsh-local-telemetry(dsh-telemetry 名已被第三方占用)。
Installer
dsh plugin --profile web add github:duyanta123/dsh-telemetryREADME
dsh-telemetry
English | 简体中文





A local-first Harness telemetry plugin: records request, model, tool, and plugin lifecycle metrics (latency, tokens, cost, errors, cache) — no conversation content collected by default.
The npm package is named
dsh-local-telemetry(thedsh-telemetryname on npm is taken by a third party); the GitHub repository remainsdsh-telemetry. Both refer to the same project.
Positioning
dsh-telemetry is a Harness runtime observability plugin. It does not do business analysis, does not modify request content, and does not upload user conversations to any third-party platform.
It answers:
- How long did a request take?
- Where did the time go — model, tool, plugin, or queuing?
- What are the input/output token counts and retry costs?
- Which tool calls are slowest and most failure-prone?
- Which plugins throw exceptions or block?
- Is the cache hitting, and is model routing saving cost?
- Are there oversized contexts, tool-call loops, or abnormal retries?
One-line positioning:
Make Harness behavior measurable without collecting sensitive conversation content by default.
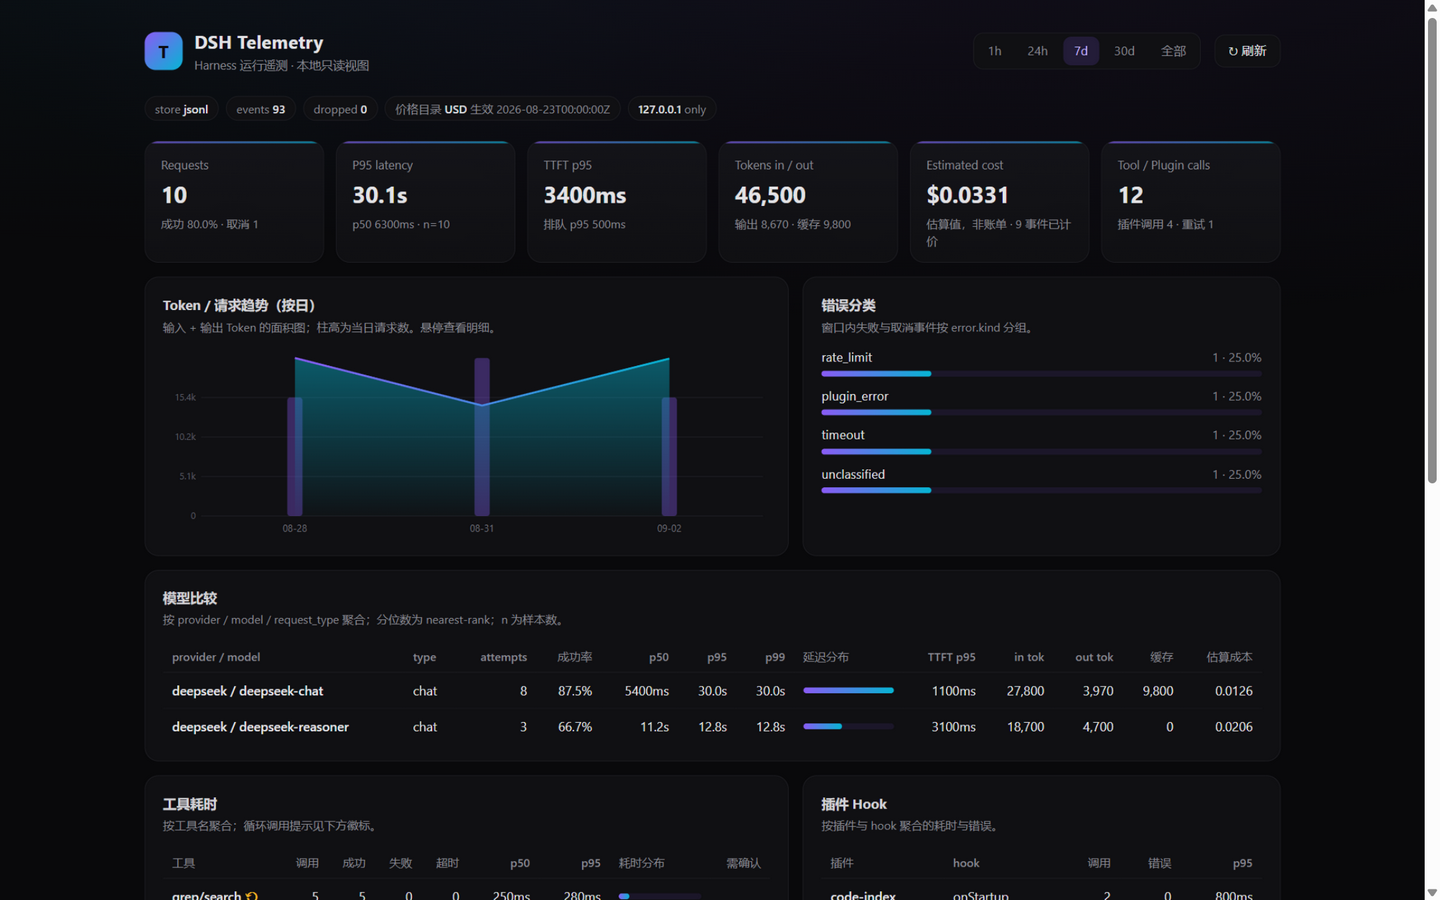
UI Preview
Dashboard overview — requests, P95 latency, time-to-first-token, tokens/cache hits, estimated cost (computed automatically once a price catalog is configured), and error classification. Every metric is annotated with its sample count and can be recomputed from raw events:
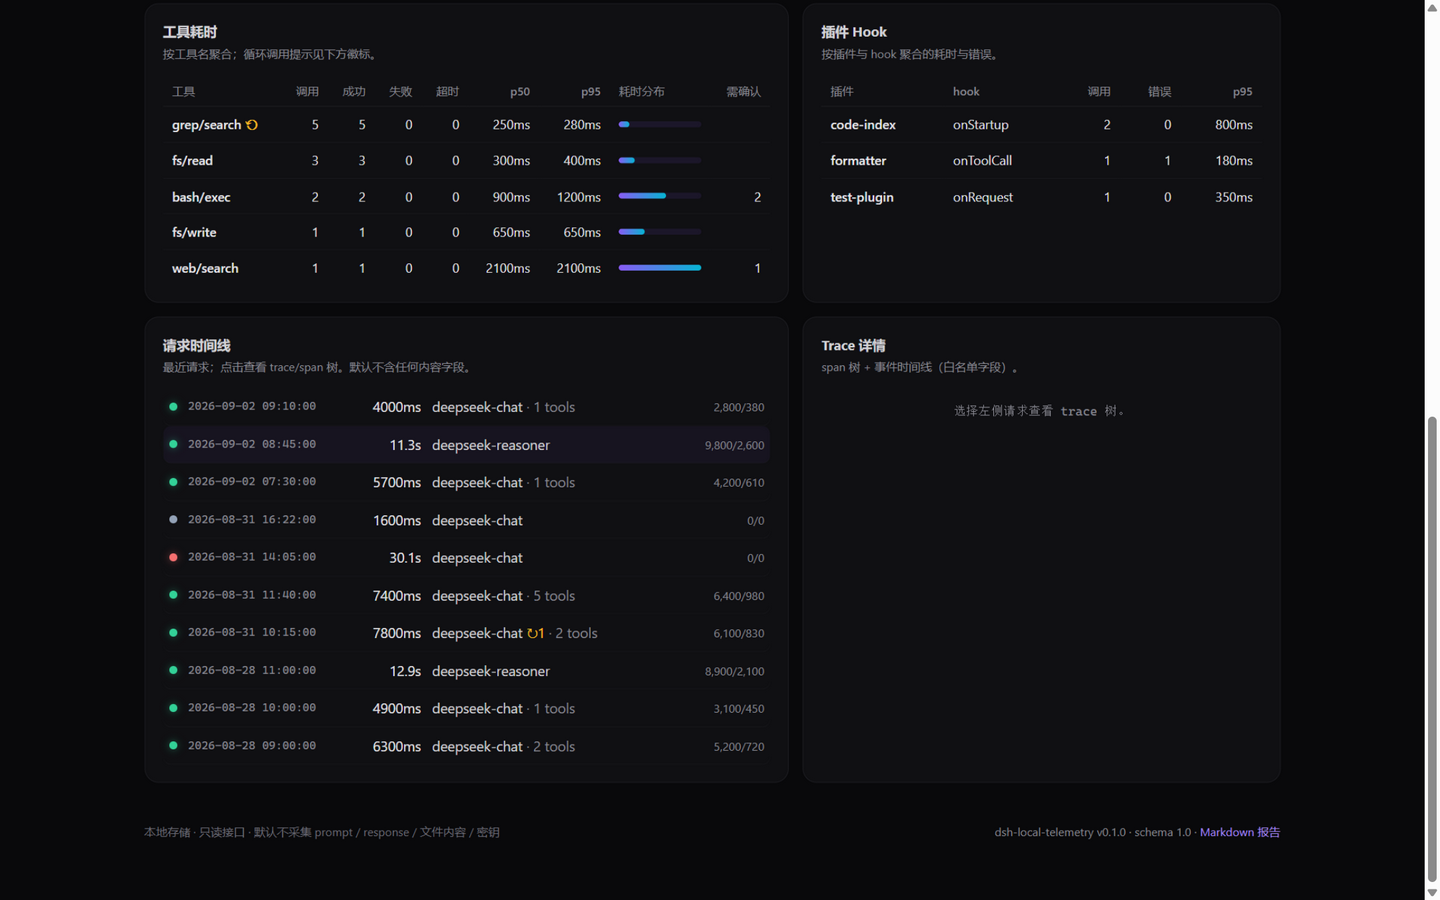
Tool & plugin timing — loop-call ⚠ warnings, counts of calls requiring user confirmation, and plugin hook error statistics; the request timeline below uses status dots for success/failure/cancel, with ↻ marks on retried requests:
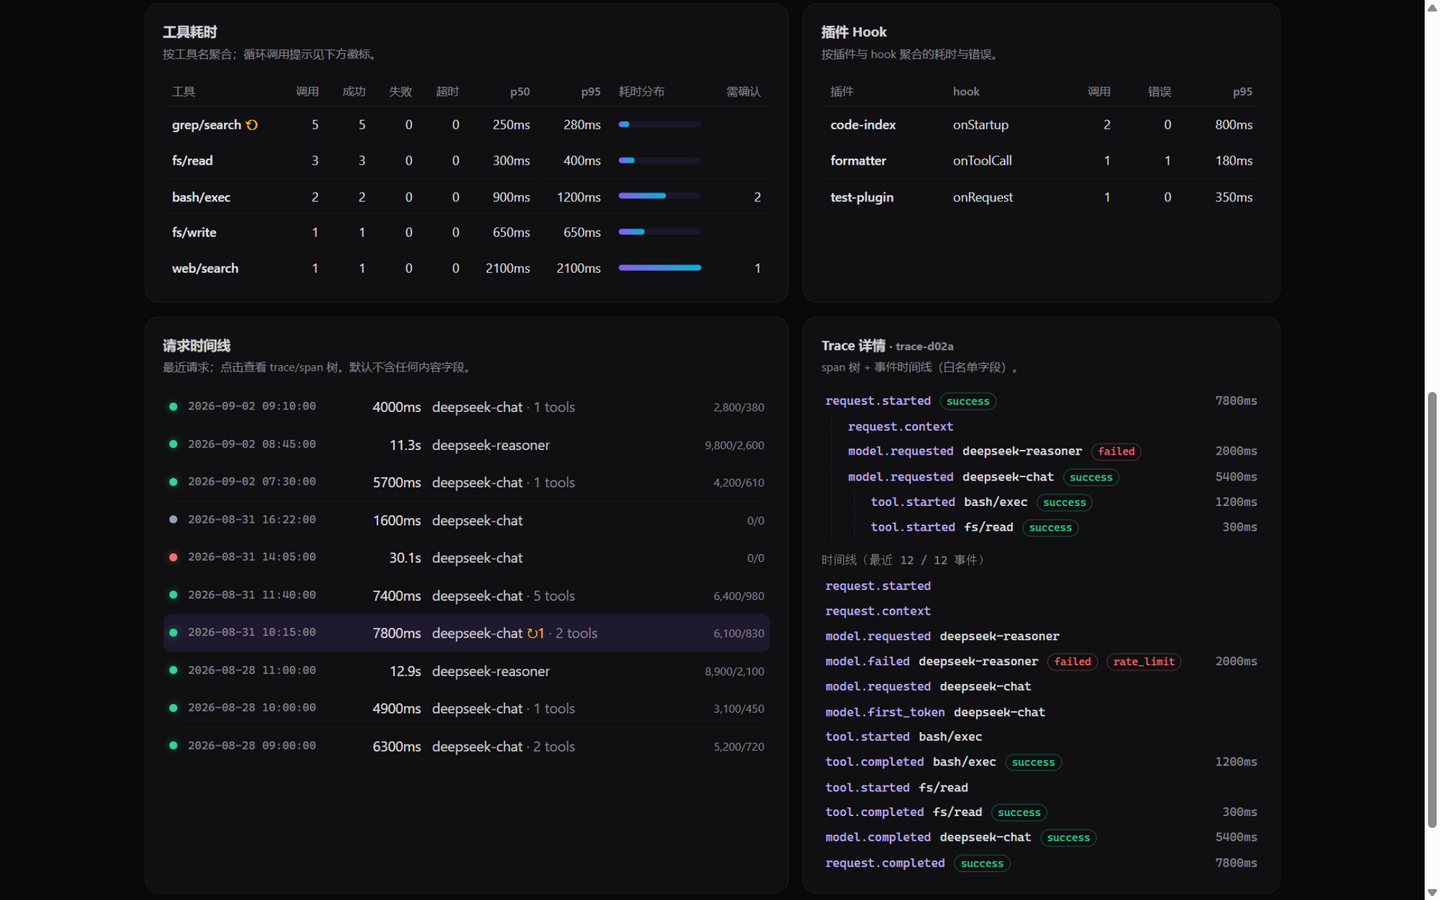
Trace details — click any request to expand its span tree and event timeline; the screenshot below shows the full chain of deepseek-reasoner hitting rate_limit and falling back to deepseek-chat successfully (each attempt timed independently):
All screenshots show the local read-only Web UI (
--ui, bound to 127.0.0.1 only) with a demo dataset; by default no prompt / response / file content / secrets are collected.
Installation
As a DSH plugin (recommended):
dsh plugin --profile web add "github:duyanta123/dsh-telemetry#main"
Compatibility tiers: JSONL and pure CLI capabilities run standalone on Node.js >= 18; the SQLite backend requires Node.js >= 22.5; as a DSH 0.1.5-rc.2 plugin it is verified with Node.js >= 22.19. Run npm run test:compat to execute an isolated-profile add, dump-config, and startup smoke test.
Or install from npm (as a library or standalone CLI):
npm install dsh-local-telemetry
After installation, restart dsh --profile web; the telemetry-runbook skill then guides the query CLI:
node bin/telemetry.mjs --status
node bin/telemetry.mjs --summary --since 24h
node bin/telemetry.mjs --trace <trace_id>
node bin/telemetry.mjs --ui --port 47610
Quick Start
1. Use as host integration code
Events come in through an explicit adapter (currently the only recommended way):
import { createRecorder } from 'dsh-local-telemetry/telemetry';

const recorder = createRecorder({
  config: {
    path: '~/.dsh/telemetry',
    capture_metadata: 'safe', // default 'none': no content collected
    hash_names: false,
    sample_rate: 1,
    errors_always_sample: true,
    slow_request_ms: 10000,
    retention_days: 7,
  },
});
await recorder.start();

// Record an event (missing id and timestamp are filled in automatically)
recorder.record({
  event: 'model.completed',
  trace_id: 'trace-001',
  span_id: 'span-003',
  parent_id: 'span-001',
  timestamp: '2026-08-23T12:00:00.000Z',
  model: { provider: 'deepseek', name: 'deepseek-chat', request_type: 'chat' },
  usage: { input_tokens: 4200, output_tokens: 860, cached_input_tokens: 0, reasoning_tokens: null },
  result: { status: 'success', finish_reason: 'stop' },
});

// Flush before exit; failures never block exit
await recorder.close();
2. Aggregate reads (referenced by higher-level plugins)
import { openStore, aggregateEvents, buildTraceView } from 'dsh-local-telemetry/telemetry';

const store = await openStore({ store: 'jsonl', path: '~/.dsh/telemetry' });
const { events } = await store.readEvents({ fromMs: Date.now() - 3600e3 });
const summary = aggregateEvents(events, { catalog: null });

console.log(`P95 latency: ${summary.requests.latency.p95}ms, Input tokens: ${summary.tokens.input}`);
3. Invoke via the DSH skill (the skill guides the CLI)
node bin/telemetry.mjs --summary --since 1h --group-by model
node bin/telemetry.mjs --export TELEMETRY-REPORT.md --since 7d --format markdown
node bin/telemetry.mjs --purge --before 30d
node bin/telemetry.mjs --ui --port 47610
CLI Options
| Option | Default | Description |
|---|---|---|
--store jsonl|sqlite | jsonl | Storage backend (sqlite requires Node ≥22.5) |
--path <dir> | ~/.dsh/telemetry | Data directory |
--config <file> | - | Config file |
--since <duration|ts> | - | Window start (e.g. 1h / 7d / ISO timestamp) |
--until <duration|ts> | - | Window end |
--profile <name> | - | Filter by profile |
--model <name> | - | Filter by model |
--plugin <name> | - | Filter by plugin |
--event <name|prefix.*> | - | Filter by event (e.g. model.*) |
--group-by <key> | - | Group by: model|plugin|tool|profile|day |
--format text|json|markdown | text | Output format (--export infers from the .json/.md extension when unspecified) |
--errors-only | - | Show errors and cancels only |
--slow-over-ms <N> | - | Show requests taking ≥ N ms only |
--sample-rate <0..1> | - | Sampling rate (recorder-side config) |
--capture-metadata none|safe | - | Metadata capture (recorder-side config) |
--purge --before <d> | - | Retention cleanup |
Privacy & Security
- No content by default: prompts, responses, file contents, command arguments, environment variables, and secrets are never collected.
- Sanitization: sensitive keys (Authorization, Cookie, token, password, api_key, etc.) are dropped whole; URL credentials and query tokens are redacted; absolute paths can be reduced to basenames or hashes.
- Name hashing: tool, plugin, model, and profile names can be hashed — stable but not directly reversible.
- Local storage: defaults to
~/.dsh/telemetry(JSONL files per day, optional SQLite); no network access. - Read-only UI:
--uibinds to 127.0.0.1 only and never exposes to the LAN by default.
Troubleshooting
--store sqlite fails to start?
The SQLite backend relies on the built-in node:sqlite, which requires Node >= 22.5. Check with node --version, or switch to the default JSONL backend (Node >= 18 suffices).
Web UI unreachable, or the port is taken?
--ui binds to 127.0.0.1 only (by design, never exposed to the LAN); access remote machines through an SSH tunnel. If the default port 47610 is taken, change it with --port.
Cost shows as null in summaries?
Cost = token usage × price catalog. Without a catalog (--config or prices.json in the data directory), cost is recorded as missing (null, not 0) and can be recomputed for past events once configured; see docs/schema.md for field semantics.
--status says collection is not active?
On config parse failure the recorder degrades to disabled (fail-open, a safe default) — check the config file syntax and field names. JSONL events are written per-day under ~/.dsh/telemetry; confirm today's file exists there.
Old sessions won't open after upgrading the DSH host to 0.1.5.x? The Session format V3 migration is irreversible and is host behavior; back up session logs before upgrading the host (see the 0.1.2 entry in CHANGELOG.md).
Documentation
- docs/configuration.md — config file, field tables, sanitization rules, resource budgets, price catalog format
- docs/schema.md — event contract schema version 1.0, 12 event types and field constraints
- examples/telemetry.json / examples/prices.json — config samples
- CHANGELOG.md — release notes
- DSH-TELEMETRY-开发计划.md — design and iteration history
Versions & Roadmap
- v0.1.0 (released): local JSONL + optional SQLite (built-in
node:sqlite, Node ≥22.5), request/model/tool/plugin base events, start/stop config, fail-open,--status/--summary/--trace/--export/--purge/--ui, no content by default, sampling and retention policies, price catalog and sanitization, Markdown reports, trace/span tree and timeline views. - v0.1.1 / v0.1.2 (released):
npm run test:compatcompatibility gate and three-tier compatibility notes; DSH host baseline migrated to0.1.5-rc.2(zero plugin code changes). - Future iterations follow DSH-TELEMETRY-开发计划.md.
License
MIT
Plugins associés
archify (deepseek-harness)
tt-a1i/archify
WeKnora (dsh-weknora)
tencent/weknora
weknora
tencent/weknora
BrowserSkill (dsh-plugin-browserskill)
tencent/browserskill