dsh-llm-manage
philyue/dsh-llm-manage
DeepSeek Harness: ds-llm-manage. 模型管理(收藏、置顶、探活),熟练度排序,故障自动切换,防止长任务中途中断
Installer
dsh plugin --profile web add github:philyue/dsh-llm-manageREADME
dsh-llm-manage
A persistent DeepSeek Harness plugin that manages the model inventory of a configured LLM route: pins and favorites, a per-model reason why each model is unusable, gateway directory reconciliation, and automatic fallback when one model's quota runs out.
No screenshots are committed, on purpose. screenshot.mjs captures a running harness,
so the images show whatever routes and model inventory that harness has — the maintainer's own
deployment. A route name rendered into a PNG cannot be found by a text scan, which is how a
set of them was published once. Run the script against your own harness (see
Looking at the panel without restarting) and you
get your own routes, which is the only version of that picture that means anything to you.
Why
A route that aggregates many providers behind one gateway exposes its whole catalogue as one flat list. Five things then go wrong at once, and none of them is the gateway's fault:
| Pain | What this plugin does |
|---|---|
| A long list, favorites buried | Pin and favorite models; the picker lifts them into their own sections at the top, and the panel sorts pinned → favorite → recent → rest |
| No sense of which models you actually rely on | A local ledger levels each model by how often you use it and ranks the rest by 14-day heat, shown as a Most used card in the panel and a ranked section in the picker |
| Retired models still listed; selecting one errors | Reconciles the route's models: list against the gateway's own GET {baseURL}/models directory and flags anything missing as retired |
| Quota exhausted, manual switching | Watches agent/request-error, moves the session to the next usable model on a model-scoped failure, and reports the switch only once the model that answered confirms it |
| The same model served by several providers | Marks each row with how many other routes also serve it, instead of hiding the copies |
| Models that cannot be called at all | Probes with a minimal request and labels the incompatibility honestly |
Nothing here is hard-coded to one gateway or one model id.
Install
From the npm registry (the packaged release, no toolchain needed):
dsh plugin --profile web add dsh-llm-manage
dsh plugin forwards the arguments after --profile <name> to pnpm inside that profile's
directory, so anything pnpm accepts works here (add, remove, why, …). The profile maps
node_modules/dsh-llm-manage to the package from the registry.
Development installs
Prefer the npm package for a normal installation. Two alternatives are useful while working on the plugin itself:
- Install from a path to link the directory, so local edits show up without reinstalling:
This symlinks the working copy — ideal when you are the author. Every edit is live, which is why "Applying a change" below is written for it.dsh plugin --profile web add /absolute/path/to/dsh-llm-manage - Install from the git URL to get a fixed copy of the latest source rather than the npm
release:
dsh plugin --profile web add git+https://github.com/PhilYue/dsh-llm-manage.git
The package installs as a bundle: its dsh.bundle.patch row inserts one Host plugin, and
its dsh.client declaration makes the web shell load the browser half. The Host half
needs a full harness restart; the browser half is picked up by the client HMR watcher,
so a page refresh is enough. See "Applying a change" below.
Configuration
Every value lives in the plugin row's config, so your own patch layer keeps overrides
across upgrades. Defaults:
- id: llm-manage
  name: 'dsh-llm-manage'
  config:
    selector:
      mode: managed     # 'native' withdraws the shadowed picker
    probe:
      intervalMs: 1200  # delay between deep probes
      timeoutMs: 30000
      batch: 40         # probes accepted per request
    directory:
      ttlMs: 1800000    # how long a gateway directory read is trusted
    fallback:
      enabled: true
      chain: []         # 'route/model' entries, tried first
    usage:
      enabled: true     # local proficiency/heat counters
      seed: true        # one pass over existing session logs at startup
      flushMs: 5000     # counters are batched to disk on this interval
The fallback chain order is: fallback.chain, then pinned models, then favorites, then the
remaining models on the same route, then other routes. Models already known to be retired,
protocol-incompatible, hidden, or inside their quota cooldown are skipped. At most three
automatic switches happen per turn.
Which failures switch, and which never do
The rule is scope, not severity:
| Failure | Scope | Switches? | Recorded against the model? |
|---|---|---|---|
| model not found / retired | one model | yes | yes |
| wrong protocol for this route | one model | yes | yes |
| per-model quota exhausted | one model | yes | yes |
| other per-model failures | one model | yes | yes |
| no adapter registered for this route | the whole route | yes | no |
| account-wide rate limit | the whole API key | never | no |
| account-wide quota | the whole API key | never | no |
A model-scoped failure moves to another model, because a different model can serve the turn. An account-scoped failure never moves: every model shares that key, so switching would only hide the real problem and burn another request.
A route with no adapter is its own scope. Switching models on that route cannot
help — every model there fails the same way — but switching to another provider can, so
it still switches. What it must not do is land in the model's health record: error is
in the set of reasons that make the fallback chain skip a model, and unlike quota that
verdict has no staleness escape, so a single route misconfiguration would have removed
an innocent model from every future chain permanently.
A probe is not a routing event
"Unusable" and "move the conversation" are two different conclusions, and only a failed request reaches the second one:
- A failed request (
agent/request-error) is the live conversation hitting a wall. If the failure is model-scoped, the turn is retried on the next usable model and a banner names the model it moved for. - A failed probe is an answer to a question you asked about a model. It records that model's health — so the next real switch skips it — but it does not touch whichever session happens to be using it. Moving a live conversation because of a diagnostic you ran would be switching models behind your back, which is the thing this design forbids.
Concretely, with model-gamma selected and its quota exhausted:
| Event | Selected model afterwards |
|---|---|
you deep-probe model-gamma, and the probe fails | still model-gamma |
a real request on model-gamma fails with per-model quota | model-beta (next usable), banner shown |
| a real request fails with an account-wide key limit (2008) | still model-gamma |
At most three automatic switches happen per turn, and if the chain finds nothing usable the failure is passed through untouched rather than retried in a way that cannot succeed.
The switch happens, and the banner proves it
Two mechanisms move a model, and the difference matters:
- The session's own selection (
sessionController.selectModel) is what makes the change real. It validates the target against a registered adapter and appends a durablemodel/selectionevent, so the model the conversation uses actually changes and every surface agrees. The saved default model is put back afterwards: an automatic recovery has no business permanently changing which model new sessions start on. - A per-request override, bound to the exact turn and step it was decided for, is what recovers the turn already in flight. It is needed because the harness applies the session selection during prompt assembly, which happens once per step — before the retry loop — so the session change alone would only take effect on the next turn.
The banner then reports what was proven, not what was decided. A switch is recorded as pending, and only promoted to something you are shown once a committed assistant message names the model that actually produced the response:
| What the answering model was | What the banner says |
|---|---|
| the model we switched to | Model switched, with Switch back |
| a different model | Switch did not take effect, naming the model that actually ran |
| no message — the turn ended | Switch attempted, turn not recovered |
The earlier version wrote the banner when the switch was decided, so a retry that failed, was aborted, or ran on a third route produced the same "switched automatically" text. It also hardcoded "exhausted quota" as the cause for every failure, including failures that were not about quota at all. Each reason now has its own wording, and the provider's raw message is one clamped line with the full text on hover — inlined in full it was up to 400 characters, which made the banner taller than the conversation around it.
Two controls sit on the banner: Switch back (offered only once a switch was confirmed, since it moves the session's model back) and Stop switching, which suppresses automatic switching for that session until the harness restarts.
Some gateways report a model's quota exhaustion as HTTP 429, which the harness's own
classifier maps to a retryable RATE_LIMIT — indistinguishable from an account-wide rate
limit. The two need opposite handling, so this plugin reads the gateway's numeric business
code out of the error body instead of trusting the mapped code. The code table is at the
top of index.js; adjust it there if your gateway numbers things differently.
Why probing is manual
GET /v1/models is free but is only a directory, not a callability list: a model can be
advertised and still fail on first use (wrong protocol, no capacity, image-only). Probing
each model deeply is therefore the only way to learn whether it works — and deep probes
spend the gateway's per-key rate budget, so a sweep large enough to be useful is also
large enough to rate-limit the user out of their own gateway.
Health is learned cheapest-first instead:
- the free directory set,
- real request failures as they happen (passive, zero extra traffic),
- explicit probes the user starts, throttled at
probe.intervalMsand capped atprobe.batch.
Each row's status is the strongest evidence available, in this order:
| Status | Means | Shown when |
|---|---|---|
retired | the gateway no longer lists the model | the directory read succeeded and the model is absent from it |
| the recorded health | a probe or a real request produced a verdict | any health record exists for that route+model |
ok | the gateway lists it, and no failure is known | the directory read succeeded and there is no health record |
unknown | nothing is known | the route exposes no baseURL, so there is no directory to compare against |
ok therefore means "listed and not known to be broken", which is weaker than "verified
working" — a model can be advertised and still fail on first use. The panel keeps the
distinction visible by showing the source alongside the status, so a row reads
usable · deep probe once it has actually answered and usable · never checked while it
has not. Neither is hidden: the second is the honest label for the majority of a large
catalogue, because verifying all of it at once is what would rate-limit you out.
Verifying it
Four suites, all runnable without any particular deployment:
node verify.mjs          # Host half: registry, gateway, classification, fallback
node verify-client.mjs   # Browser half: renders the panel in jsdom and clicks it
node verify-browser.mjs  # Control geometry in a real engine (headless Chrome)
node verify-live.mjs     # The whole thing against a RUNNING harness (opt-in)
Each suite picks a mode automatically:
real— this machine has a profile whose first provider route resolves, plus that route's credential. The settings under test are then the deployed ones, and the gateway directory is read live. This is the mode that catches a fixture agreeing with a wrong assumption.synthetic— otherwise. A local stub serves a synthetic catalogue, so every code path still runs: offline, deterministically, with no credential and no internal endpoint.
LLMM_VERIFY_MODE=synthetic node verify.mjs    # force a mode
DSH_CHECKOUT=/path/to/deepseek-harness node verify.mjs
DSH_CHECKOUT points at the harness checkout, which supplies the real Tool registry,
React and jsdom. It is not vendored here; the suites try a few conventional locations and
then tell you what to set.
verify.mjs also gates the publish surface: where the maintainer's
company-information scanner is present it fails if the runtime files (index.js,
client.js, package.json, cordis.patch.yml, icon.svg) contain anything identifying
a particular employer or internal service; in this published package the scanner is
absent, and the gate says so rather than reporting a pass it did not perform. The scanner
is not shipped because its own rule patterns have to quote the identifiers they look for.
Some checks exist because the live harness caught bugs a shallower suite passed:
-
The suites execute the registered tool, not just register it. A definition can register cleanly and throw on its first call.
-
The fixture context enforces Cordis's inject guard, so reading
ctx.llmfromapply's own context fails exactly as it does live. -
Never test one half alone. The two halves can agree on every type and still disagree on a field name: the panel once folded
data.snapshotwhile the Host returned the same state undervalue, so pin/favorite/hide updated nothing until the user reloaded by hand. A Host-only suite passed it, and so did a client suite whose other half was a mock returning whatever field the client asked for. -
verify-browser.mjsexists because jsdom has no layout: everygetBoundingClientRect()returns zeros, so a tooltip's position and a button's width cannot be measured in-process. It loads the real panel into headless Chrome and asserts the geometry the design depends on, then skips with exit 0 when no Chrome-family binary is present (CHROME_PATHoverrides). -
verify-live.mjsexists because every other suite builds its own page and hands the plugin a context it controls — so none of them can catch a contract they do not enforce. The plugin declaredslots,modelDirectoriesandsessionsat the top level, then calledmodelDirectories.directoryFor(), which internally reachesthis.ctx.remote.session. Cordis checks the consumer's inject list, so in the live app that read threwcannot get property "remote.session" without inject, the picker's slot entry crashed, and becauseStylerenders inside that same subtree the composer's model control lost every rule in its stylesheet. All three suites were green: the hand-built contexts were plain objects that enforced nothing.It opens the URL
dsh webprints — in a real engine, against the real profile, real catalogue and real composer — and skips with exit 0 when no live harness answers:DSH_LIVE_URL='http://127.0.0.1:3080/?token=...' node verify-live.mjs DSH_LIVE_URL=http://127.0.0.1:3080/ DSH_LIVE_COOKIE='dsh-auth-...=...' node verify-live.mjs
Two more contract mistakes the suites had to learn
Both of these shipped, both were green in every suite, and both were found by looking at the running app. They are worth stating because each one changed what the suites assert.
The theme cannot be supplied by the thing being tested. The card was painted with
--dsw-alias-bg-overlay, which the plugin token contract labels "Overlay and popover
background" — a reasonable reading of the docs. Measured in the app it is #e9ecf2, a mid
grey, darker than the white composer it drops out of; DSH's own popovers paint the
translucent --dsw-specific-menu on a child layer with a backdrop blur instead. The suites
could not catch it because they defined that token themselves: verify-browser.mjs had
--dsw-alias-bg-overlay:#fff, and the deleted preview.mjs invented the same white. The
suites now carry the values the app actually resolves, and verify-browser.mjs fails if the
stylesheet reads any token its theme block does not define — 27 are read. verify-live.mjs
asserts the painted surface against the token's real value.
A stylesheet in a template literal can truncate without a syntax error. A backtick or
${ inside a CSS comment ends the literal early. The pieces often still re-parse as
JavaScript, so node --check passes, and the failure that reaches you is a browser refusing
the import — the whole client half silently absent. verify-client.mjs extracts the literal
and asserts it is intact, which catches the case that parses but is wrong.
The lesson generalizes past this bug: a suite that supplies the context cannot verify the context. An inject declaration is a contract with the runtime, and only the runtime can check it.
Looking at the panel without restarting
DSH_LIVE_URL='http://127.0.0.1:3080/?token=…' node screenshot.mjs
Captures the panel and the model picker out of the running harness, light and dark, into
docs/ — which is gitignored, so the images stay on your machine. It is the preview of record
because it supplies nothing: it opens the URL dsh web printed and photographs what is there.
The images are not committed because a capture of a real harness is a picture of the routes
and model inventory that harness is configured with. That is the maintainer's deployment, and
it is also the one kind of content a text scan cannot inspect: a route name rendered into a
PNG reads as PNG bytes, matches no rule, and passes. Four such screenshots were published
before anyone noticed. build-public.mjs now refuses to stage any binary asset, and
scan-company-info.mjs reports files it cannot read as unscannable rather than counting them
as clean — the whitelist that decided which extensions to open was the whole defect.
This replaced a preview.mjs that rendered the plugin into a hand-written page with a
hand-written theme. That page defined --dsw-alias-bg-overlay:#fff — a value the token never
has in the app, where it is #e9ecf2 — and defined only the 14 tokens the plugin contract
documents while the stylesheet reads 27. The mock showed a white card; the app painted a grey
one. A preview that supplies its own theme cannot show you the theme, and an approved mock is
worse than no mock: it is the reason the grey card shipped.
The replacement supplies nothing of its own and skips with exit 0 when no harness answers, so
it never reports a picture it did not take. To reach the panel it sends the settings.open
chord — primary+alt+Comma on web, not the plain primary+Comma the desktop runtime uses —
then clicks through the settings nav until the panel appears, matching no label because the
labels are localised. A development aid, not a test.
Where it appears
- Settings → Models → the provider card: the management panel.
- The composer model picker: the managed picker (set
selector.mode: nativeto withdraw it and get the shipped picker back untouched). - Above the composer: a banner when this session's model was switched.
The composer model picker
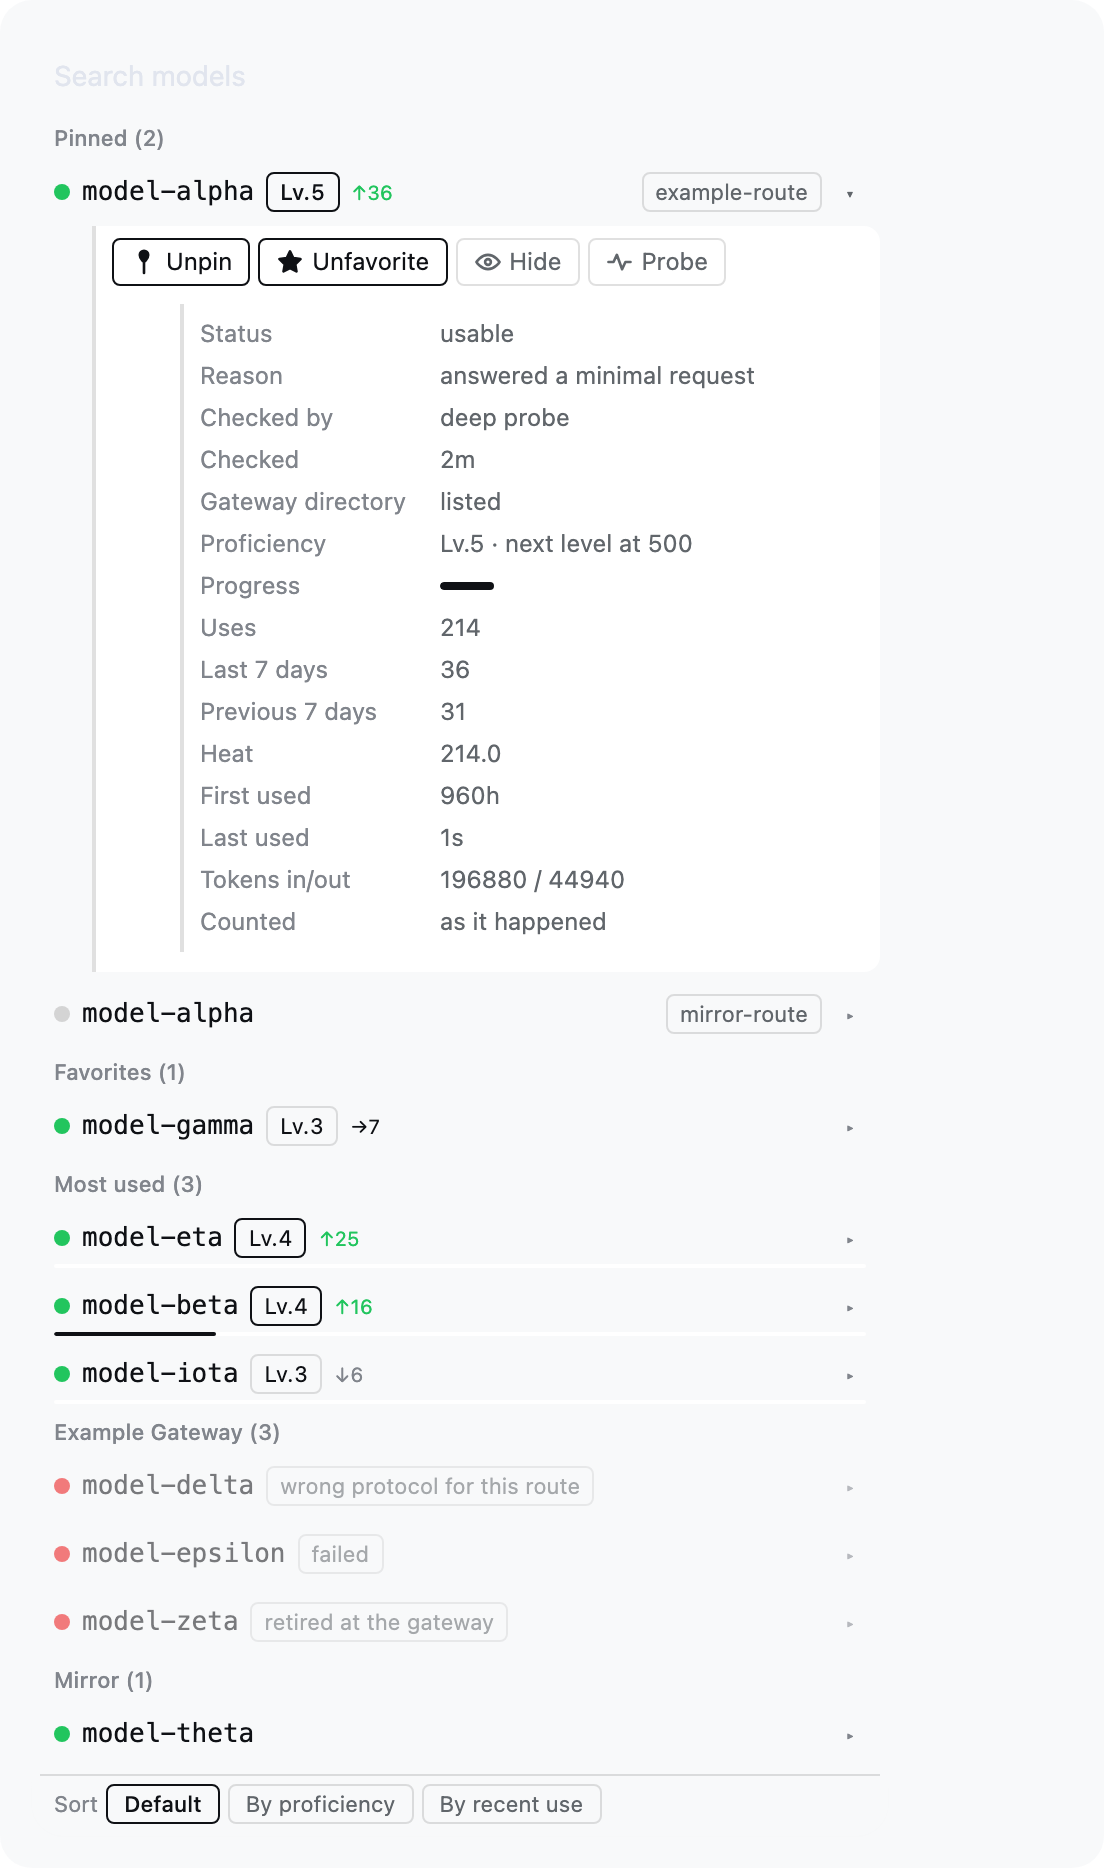
The picture is a synthetic render, not a photograph of anyone's harness: preview.mjs
renders the real plugin code against an invented catalogue — fake models on fake routes —
so the screenshot cannot contain a route you do not already have in front of you in the
source. To see it against your catalogue instead, run screenshot.mjs against your own
harness: it drives the real settings UI — sending the settings.open chord and finding the
Models section — so what you get is your own catalogue in your own theme.
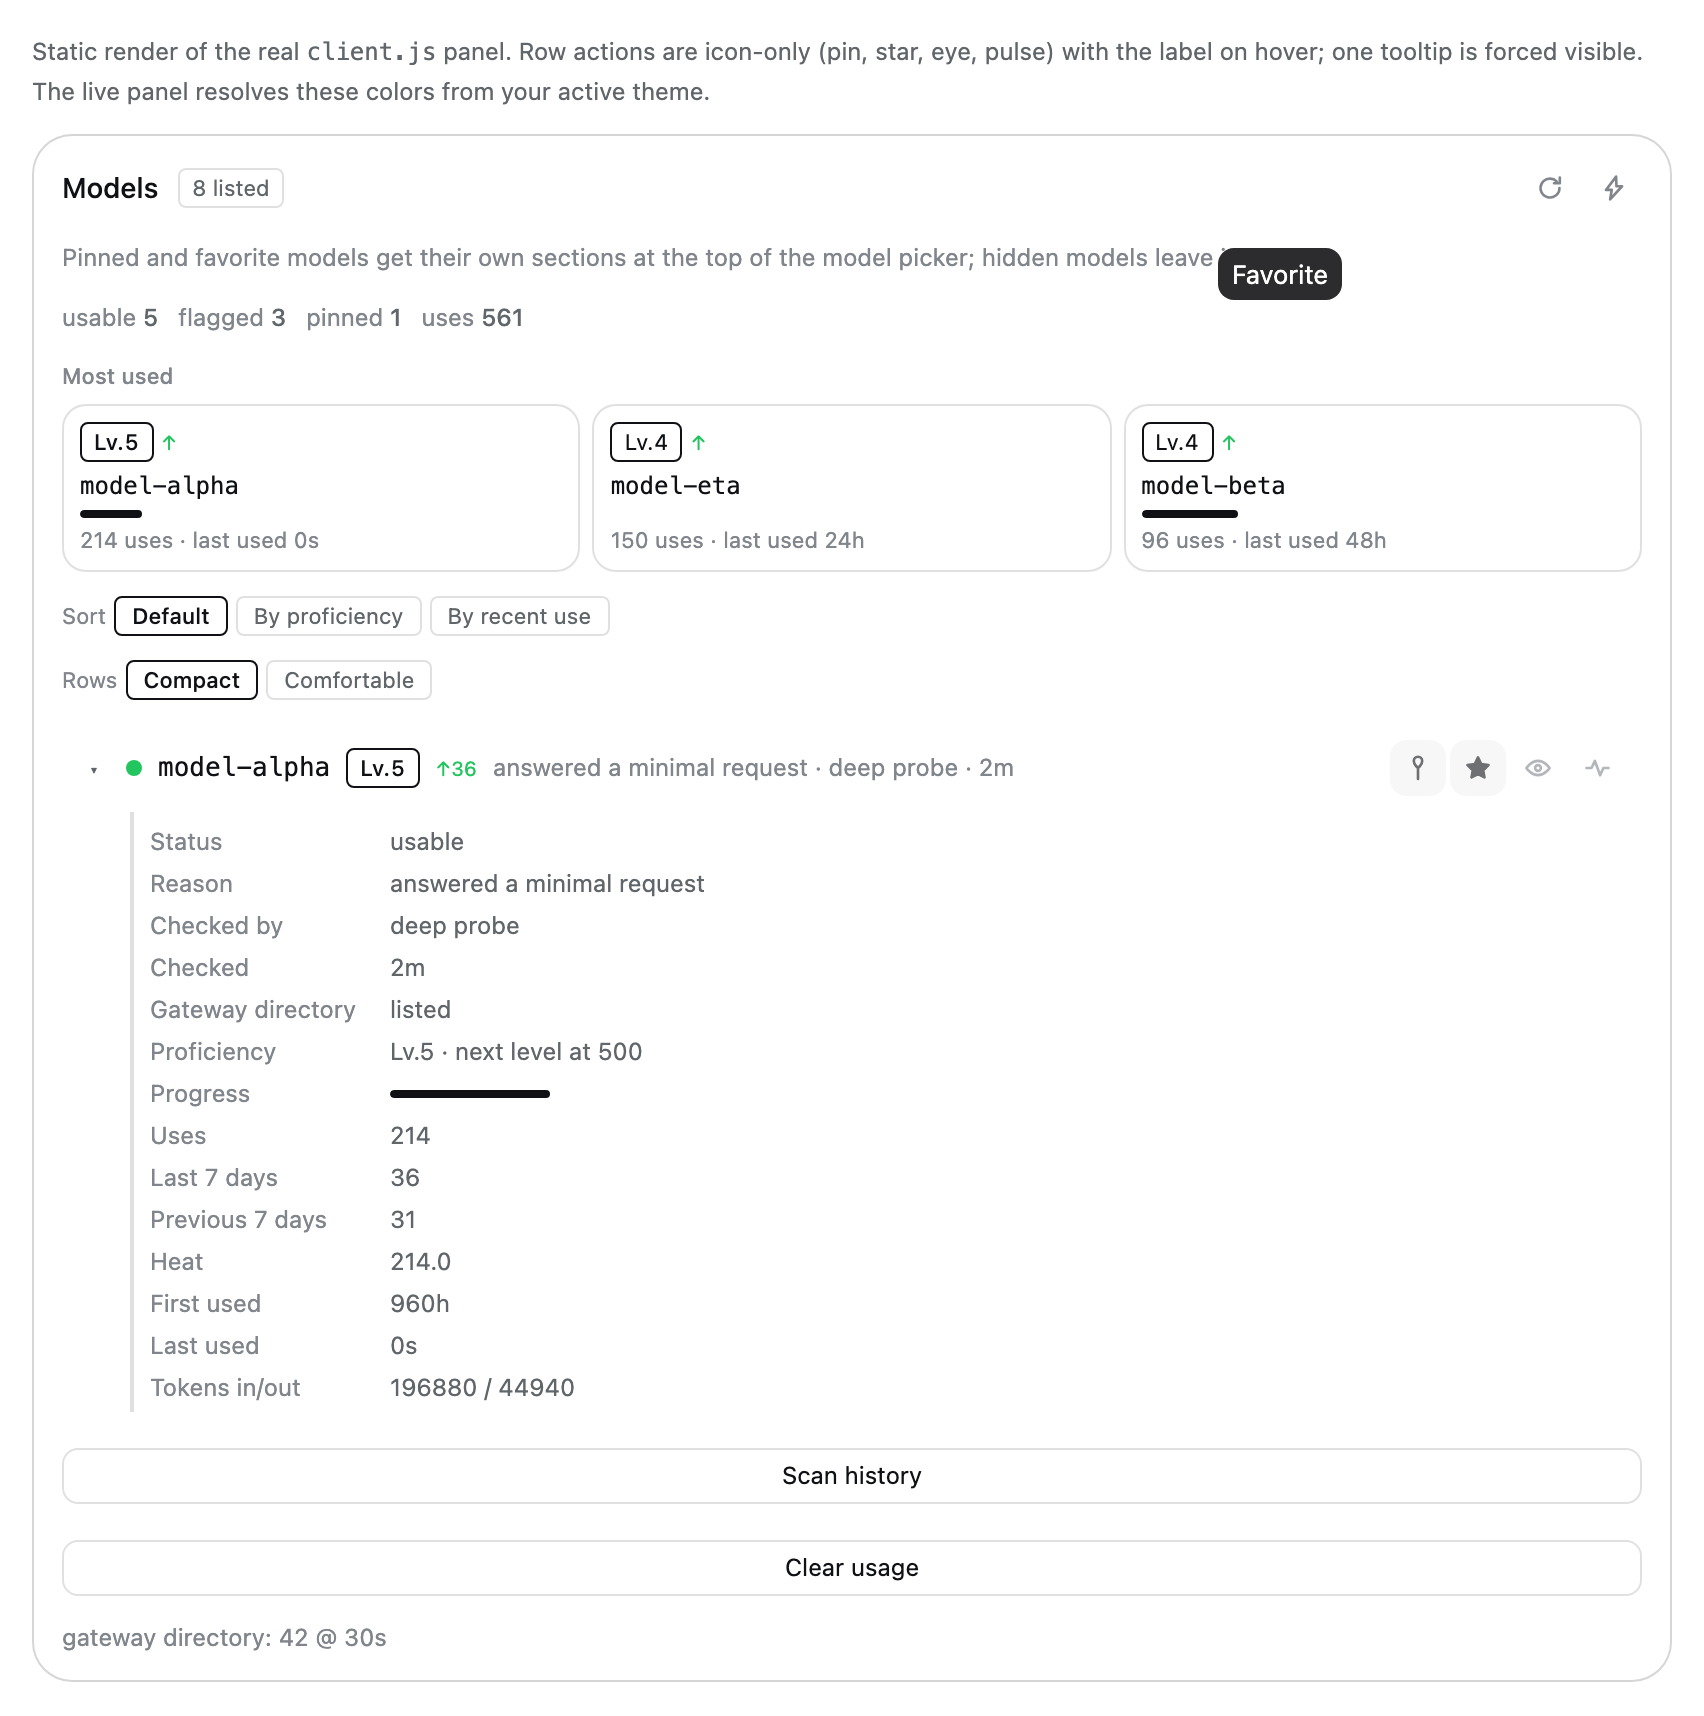
The panel, from the same renderer:
The picker opens on Pinned, then Favorites, then Most used, then one section per route. Pins and favorites are lifted out of their route and shown once, at the top, so a favorite is one click away no matter how many routes the profile has or how many models sit ahead of it alphabetically. Below the sections, each route still lists everything else, minus the rows already lifted — every listed model is offered exactly once. Hidden models are not selectable, but they are not discarded either: they collect in a Hidden section at the bottom, which is the only place the menu can offer them back.
A model that is both pinned and favorited appears under Pinned only, matching the fallback chain's own precedence, where a pin outranks a favorite.
Most used is earned rather than declared: it holds the five models this profile reaches for most, ranked by heat, so the models you actually work with rise to the top without being pinned by hand. It is capped, because it is a shortcut to the top of the list rather than a second copy of the catalogue, and it never repeats a pin or a favorite.
Because a lifted row is no longer under its route's heading, a section that spans more than one route prints the route beside each model. The same model id on two routes is two different selections, and the row has to say which one it means. A section that stays on one route prints nothing, since the label would be noise on every row.
Rows keep their health dot and reason chip, so an unusable model is visibly unusable here too — but it is still selectable. The plugin's view of a model can be stale, and hiding a model from the picker is the one thing this design refuses to do silently. Search filters across the lifted sections as well as the route groups.
A model that has been used carries a proficiency chip beside its name (Lv.3) and, when
this week differs from last, a trend arrow with the 7-day count attached (↑12, ↓4).
The count is the part that carries the meaning: an arrow alone cannot be told apart from one
extra request. A model that has been used carries no trend at all once it has been idle for a
week — there is no recent use to report, and a flat arrow would invent one. A model that has
never been used carries no chip at all: a wall of Lv.1 badges on an untouched catalogue
would be noise rather than information, so the chip itself is the signal that there is
history behind a row.
Most used carries a distance-to-next-level bar under each row, because it is the one section built entirely from usage and the one where the models you are actually choosing between live. The bar is a hairline on the row's bottom edge, so it costs the list no height. Each row's tooltip spells the whole figure out — level, uses, the count that reaches the next level, tokens in/out, and whether the number came from the history scan.
Once any model has usage, a Sort control at the foot of the card orders the rows inside every section: the default designed order, By proficiency, or By recent use. It sits outside the scrolling list so it stays reachable, and it exists only when there is usage to sort by — on a fresh profile it would offer three orderings that all look alike. The two usage orderings answer different questions, and on a real profile they disagree: the model you have used most is often not the one you are reaching for today.
Managing a model without leaving the conversation
The picker is where you look at models most often, so the moment you notice one is unusable is the moment you want to act on it. Every row therefore carries a chevron that opens its management block: pin, favorite, hide, and deep probe, each with a label rather than a bare icon, above the same record the panel's detail block shows — the two surfaces render it from one component, so they cannot describe a model differently.
The chevron is the whole cost of this on a row. Four always-on icon buttons would take about a hundred pixels from a menu that is between 240 and 420 wide, and the model name is the most important thing in it; they would also turn one click target into five, so a near miss on "select" would silently hide a model. A chevron is one glyph, and it keeps every action reachable by pointer, keyboard and touch — where a hover-only strip would be reachable by pointer only.
Two consequences of putting management inside the picker are handled explicitly:
- Pinning does not move the row between sections. Freezing matters more here than in the panel, because a pin lifts a row clean out of its route group into Pinned. Section membership is frozen at the first pin or favorite and settles when the menu is next opened; what the row reports stays live, so the button lights up immediately. Freezing the row's own flags — the first thing this did — also froze the pin indicator, and the menu claimed the click had done nothing.
- Hiding is not a one-way door. A hidden model leaves the menu, as hiding means it should, but the menu collects hidden rows into a Hidden section at the bottom and offers Unhide in the same block. Filtering hidden rows out of the catalogue entirely — the original behaviour — made hiding from the picker permanent unless you went to settings.
A hidden model still lists in the panel, dimmed, where the same action brings it back.
The picker is styled from the panel's own vocabulary rather than as a separate design: the
same row box (padding, radius, hover background and hover border), the same dimming for
a de-emphasised row, the same focus ring, the same .llmm-chip for the route as the panel
uses for "also on", and section headings in the secondary label color. The brand color stays
reserved for state — the panel's active controls and the picker's current row. Two suites
assert this property by property, so the two surfaces cannot drift apart again.
Panel controls
Row actions are icon-only buttons with the label on hover and on keyboard focus, so
four controls fit beside a model name instead of wrapping the row: pin, favorite, hide,
probe. Each carries an aria-label, so it stays readable to a screen reader. The header's
two actions (re-check the gateway, deep-probe all) use the same treatment.
Pinning does not move the row
The default order puts pinned and favorite rows first, so re-sorting on every toggle moved the row you had just clicked to the top of the list and took your scroll position with it: scroll down to model 40 of 80, pin it, and you are looking at a different part of the list. Toggling pin, favorite or hide now changes that row's state and not its position.
The order is frozen at the first toggle and applied at the boundaries where you expect the list to settle:
- collapsing or expanding the list,
- changing the sort,
- re-checking the gateway.
While a pending change is outstanding the panel says so, because a frozen list is otherwise indistinguishable from a pin that silently did nothing. Without the freeze the row under the cursor moves; with it, the only thing that moves is the pin icon.
A row carries the decision; the detail block carries the record
A row shows what choosing needs — health dot, name, status, level, recent-form count, and a
one-line reason. Everything the Host knows does not fit on one line at a readable size, so
each row has a chevron that opens a detail block beneath it. Both the chevron and the
model name open it; the chevron is the one that carries aria-expanded and the label, so
the block is reachable from the keyboard without adding a second tab stop per row.
The block lists the record in full: status, the complete reason, what checked it and when, whether the route's gateway directory still lists it, level and distance to the next level, a progress bar, uses, the last and previous seven days, heat, first and last use, tokens in/out, and whether the numbers came from the history scan or were counted live.
A hover tooltip was the alternative and it is the weaker one: it needs a pointer, it cannot be read on a touch screen, and it cannot be held open beside a second row to compare.
Density, and why the reason leads
The reason is the most informative thing about a flagged model and the first thing a narrow row truncates. It is rendered first — the source and age trail it, because the status dot and the status chip already say most of what they say. Trailing the reason meant the ellipsis ate exactly the part worth reading.
Two densities are offered, and the choice is remembered:
- Compact (default) keeps one line per row and gives the reason the remaining space.
- Comfortable gives the reason a second line, wrapped to two lines before it truncates.
With eighty models, compact is what keeps the list scannable; comfortable is for when you are investigating one of them.
The tooltip is rendered at the panel root rather than inside the row, because the row list is a scroll container that would clip it; it is positioned against the viewport and clamped so a button near an edge cannot push the label off-screen.
Clicking an action updates the row in the same frame (the flag is applied locally first) and the Host's authoritative snapshot then replaces it. A failed request rolls the row back, so the panel never keeps claiming a state the Host refused. Row actions stay visible at reduced opacity instead of appearing only on hover, because a touch device has no hover.
Every mutating action returns the new state under a top-level snapshot; that is the
contract that makes the optimistic update safe.
Proficiency and recent use
The panel's top card is Most used: the three models this route is actually worked with, each with its level, a bar to the next level, and the number of uses. Below the counts, a sort control switches the list between the default order, proficiency, and recent use.
Both numbers come from a local ledger, and the distinction between them is the point:
- Level is earned from the lifetime count and never decreases. It answers "how much have I used this model", which is why it does not fall when you spend a week elsewhere.
- Heat decays with a 14-day half-life, so it answers "what am I reaching for now". Both Most used sections — the panel's card and the picker's — rank by heat by default, not by the lifetime total, so the oldest model does not win forever.
The level steps are 0, 10, 30, 80, 200, 500 and 1200 uses, giving levels 1–7. Tokens are recorded and displayed but deliberately do not score: a handful of enormous requests should not read as expertise.
The ledger is counted from committed assistant messages in this profile's own session logs. Nothing is sent anywhere and no request is made to build it. Concretely, three choices keep the numbers honest:
- Counting from committed messages rather than from clicks on the menu means the ledger reflects work actually done. Picking a model you then cancel does not count.
- A retried request is recorded as an attempt, never as a use. A flaky gateway would otherwise multiply one answer into several levels of proficiency. (This is also why the ledger does not hook the streaming event: that one wraps every call, including retries and replays.)
- A replayed session event is deduplicated, so resuming a session does not double count it.
The ledger starts empty, but your history does not. On startup the plugin folds the session logs already on disk into the counters, so a model you have been using for months starts at its real level instead of level 1. This runs in the background and is bounded: it scans for up to 20 seconds, yields, and resumes on the next pass, because replaying a large corpus is disk-heavy and must not compete with the live session you are in. Each session it has already counted is marked, so resuming never double counts.
When it finds an empty or partial ledger, the panel says where the pass stands — waiting for the session service, reading your logs, how many responses it counted from how many sessions, or why it stopped. It says so on failure too, deliberately: an earlier version sampled the session service once at startup, and on a host whose service registered a moment later it answered "service not available" and wrote nothing. That empty ledger was indistinguishable from a correct one, and the feature looked dead while reporting nothing at all. Scan history at the bottom of the panel starts a pass on demand.
Because the counters are local and describe your own habits, deleting them does not require
hunting for a file: Clear usage at the bottom of the panel, or the reset-usage tool
action, for one model, one route, or the whole profile. Set usage.enabled: false to turn
the ledger off entirely.
Storage
One atomically-written JSON document per route under
$DSH_HOME/storages/llm-manage/<route>.json, holding favorites, pins, hidden,
recent and health (status, source, detail, scope, at), plus the usage
counters. Deleting the file resets that route's overlay.
Usage is the one part of that document written in batches rather than per event — counters
are debounced (usage.flushMs) because a session can commit many messages in a row, and the
panel flushes before it reads. The backfill watermark lives in a separate
__usage__.json in the same directory.
Agent tool
The llm_models tool exposes the same operations: snapshot, pin, unpin, favorite,
unfavorite, hide, unhide, probe, sync, usage, seed-usage, reset-usage,
diagnostics. snapshot and diagnostics need no extra arguments; sync needs route;
probe and the overlay actions need both route and model. usage reports the ledger,
seed-usage re-runs the historical scan, and reset-usage deletes counters (all of them
when given no route). The browser half reads the same data over POST /api/llm-manage.
Applying a change after install
The profile installs this package as a symlink, so file edits land in the running profile immediately. The two halves then behave differently.
index.js (Host half) needs a full harness restart. The host HMR watcher skips
node_modules, where the install symlink lives, and its watch root is the profile
directory — while the real file resolves outside it. A marker written into index.js was
still absent from the running Host's responses minutes later, against a listener process
started the previous evening.
client.js (Client half) reloads on its own. The client HMR watcher is a stat poll
(default 500 ms) over every row in the composed graph — no node_modules exclusion — and
it re-reads the bundle from disk. Touching client.js produces a
rebuilt frame on /plugins/events, and the revision the server then advertises matches
one computed from the new file's mtime/ctime/size.
Enabling or disabling the bundle does not bust the ESM module cache for either half.
Known limits
- Deep probing assumes the OpenAI-compatible
/chat/completionsshape. A route speaking another protocol is reported as probed-with-this-shape, not as protocol-aware. - Protocol mismatches are labelled, not fixed. A model's protocol cannot be set
per-model:
apiis a route-level setting. The supported workaround is registering the samebaseURLas a second route withapi: anthropic-messages— which only helps if your gateway actually serves that endpoint. If it does not, the model is reported as protocol-incompatible rather than silently "fixed". - Passive learning needs a real failed request to observe a reason.
- The usage ledger reads session logs through the host's session service. A host that does not expose it still counts live traffic, but the historical backfill reports itself as unavailable instead of silently reporting zero history.
- The ledger is per profile, not per project: sessions from different working directories share one set of counters, because the profile is what owns the model configuration.
- A message that arrives before the plugin is loaded is not counted live. The startup
backfill covers it on the next run, unless
usage.seedis off. - The quota fallback needs the failing model's id, which it takes from the last
agent/requestit observed for that session. - The managed picker shadows the shipped picker at
priority: -1and re-supplies itsinjectface. That face is a per-registration business contract, so a future change to the shipped picker's face needs this plugin updated in step.selector.mode: nativewithdraws the shadow without a restart.
Licence
MIT — see LICENSE.