dsh-local-monitor
astelirons-ai/dsh-local-monitor
Floating, draggable sensor dashboard for the Harness Web UI on Windows: GPU-Z GPU temperature, clock and dedicated VRAM on the left, CPU temperature/clock and system memory on the right.
Installazione
dsh plugin --profile web add github:astelirons-ai/dsh-local-monitorREADME
DSH Local Monitor
A floating, draggable sensor dashboard for the DeepSeek Harness Web UI: GPU readings from GPU-Z on the left, CPU and system memory on the right.
Six live cards in one compact window:
| Left column — GPU | Right column — CPU |
|---|---|
| GPU temperature | CPU temperature |
| GPU clock | CPU clock |
| Dedicated VRAM in use (with a /16 GB bar) | System memory in use (with a /32 GB bar) |
The window can be dragged anywhere by its title bar, remembers its position across reloads, collapses to a single header row, and follows the app theme (light and dark). Labels are English by default; French is used when the DSH app locale is French, and either can be forced (see Language).
Screenshots
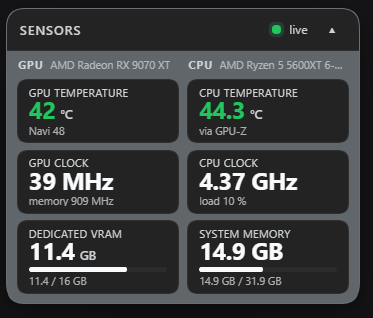
Expanded: the six live cards, GPU on the left, CPU on the right.

Collapsed: the header alone. The chevron in the top-right corner expands and collapses the window; hovering it shows "Collapse"/"Expand".
Features
- Live by default — the Host samples every second, the window refreshes every 1.5 s; a status dot shows live vs offline.
- Real GPU-Z data — reads the
GPUZShMemshared-memory block GPU-Z publishes while it runs (the exact numbers of its Sensors tab), no OCR and no screen scraping. - Floating and draggable — rendered into the frame-wide
shell.overlayslot, so it sits above every column without stealing clicks elsewhere. - Theme-aware — every colour is a Harness theme token, so it reads correctly in light and dark themes.
- No dependencies — plain React from the browser module table, and a single long-lived PowerShell child on the Host side.
Data sources
| Value | Source |
|---|---|
| GPU temperature, GPU clock, dedicated VRAM used / total, card name | GPU-Z shared memory (GPUZShmem) |
| CPU temperature | GPU-Z's CPU Temperature sensor when it publishes one; otherwise the ACPI thermal zone (labelled "motherboard zone") |
| CPU clock and load | Windows performance data (Win32_PerfFormattedData_Counters_ProcessorInformation) |
| System memory in use | GlobalMemoryStatusEx |
Requirements
- Windows 10/11 — the collector uses the Windows sensor APIs.
- GPU-Z running — download it from TechPowerUp. If GPU-Z is not running, the GPU column shows "GPU-Z not found" and the rest keeps working.
- DeepSeek Harness with a web profile.
Install
From a local checkout:
dsh plugin --profile web add link:D:\path\to\dsh-local-monitor
From GitHub:
dsh plugin --profile web add github:astelirons-ai/dsh-local-monitor
Then reload the Web UI (Ctrl+Shift+R). The window appears near the top-right
corner of the frame and can be dragged from there.
How it works
GPU-Z (shared memory)  ─┐
Windows CPU / memory   ─┼─> helper.ps1 (persistent child) ──> Host route
                        │        one JSON line per second      GET /dsh-local-monitor/sensors.json
                        └─────────────────────────────────────> client.js polls it
                                                                and renders shell.overlay
index.js(Host) spawnshelper.ps1, parses its JSON lines, keeps the latest sample in memory and exposes it as read-only JSON on/dsh-local-monitor/sensors.json. The route accepts loopback, same-origin requests only. The child is restarted automatically if it exits.helper.ps1runs one sampling loop: GPU-Z shared memory, CPU temperature and clock, physical memory. One JSON object per line on stdout.client.js(browser) registers ashell.overlayentry (id: dsh-local-monitor) and polls the route.
Tuning
Three constants at the top of client.js:
var WIDTH = 221    // window width in CSS pixels
var VSCALE = 0.45  // vertical density: 1 = original height, 0.45 = 55% shorter
var FSCALE = 0.7   // glyph scale, applied to every font size
VSCALE only compresses the vertical furniture (paddings, gaps, line heights,
card height). FSCALE shrinks the type, which is what keeps the labels inside
narrow columns; lower it when you make the window much narrower, raise it if the
labels feel too small.
The sampling interval lives in helper.ps1 ($intervalMs = 1000) and the poll
interval in client.js (POLL_MS = 1500).
Language
Labels ship in English and French. The window picks French when the DSH app locale is French, English otherwise. To pin one language regardless of the app locale, run this once in the browser console (DevTools) and reload the page:
localStorage.setItem('dsh-local-monitor.lang', 'fr') // or 'en'
Remove the override with localStorage.removeItem('dsh-local-monitor.lang').
Troubleshooting
| Symptom | Fix |
|---|---|
| Window does not appear | Reload with Ctrl+Shift+R; check the plugin is enabled in Settings → Plugins. |
| GPU column shows "GPU-Z not found" | Start GPU-Z (it may stay minimized in the tray). |
| CPU temperature says "motherboard zone" | GPU-Z is not publishing its CPU sensor on this machine; the value then comes from the ACPI zone and is approximate. |
| Numbers frozen on screen | The status dot shows offline when the Host has no fresh sample: check that powershell.exe can start and that GPU-Z is alive. |
| Nothing at all / route 404 | The Host half failed to load — check the Host log for dsh-local-monitor. |
To inspect the raw payload while debugging:
Invoke-RestMethod http://127.0.0.1:3080/dsh-local-monitor/sensors.json | ConvertTo-Json -Depth 5
Uninstall
dsh plugin --profile web remove dsh-local-monitor
License
MIT — see LICENSE.
Plugin correlati
dsh-web (dsh-task-board)
zhu1090093659/dsh-web
dsh-web (dsh-web-all)
zhu1090093659/dsh-web
dsh-TUI
ccch1mneyyy/dsh-tui
dsh-web-ui (dsh-task-board)
zhu1090093659/dsh-web-ui