dsh-strength-meter
chou109/dsh-strength-meter
强度表是 DSH Web 开源插件:设置页按模型统计 token 用量(环形图、热力图、趋势),数据仅来自本地日志。一条命令安装,重启即用。 dsh-strength-meter: a DSH plugin. Settings shows per-model token usage (donut, heatmap, trend), local logs. One command, restart.
Installazione
dsh plugin --profile web add github:chou109/dsh-strength-meterREADME
⚡ dsh-strength-meter — Model Usage Stats for DSH Web
dsh-strength-meter: a model token-usage statistics plugin for the DeepSeek Harness Web UI — a full "Usage stats" page in Settings (metric cards, per-model donut, activity heatmap, daily trend). All data comes from your local session logs; nothing is uploaded.
| Language | Link |
|---|---|
| English | This document |
| 中文 | README.zh.md |
Table of Contents
If you are a human, read this
What this plugin does
The plugin adds a full "Usage stats" page under Settings → Usage stats, presented in the following blocks:
Block 1 — six metric cards (overview at the top)
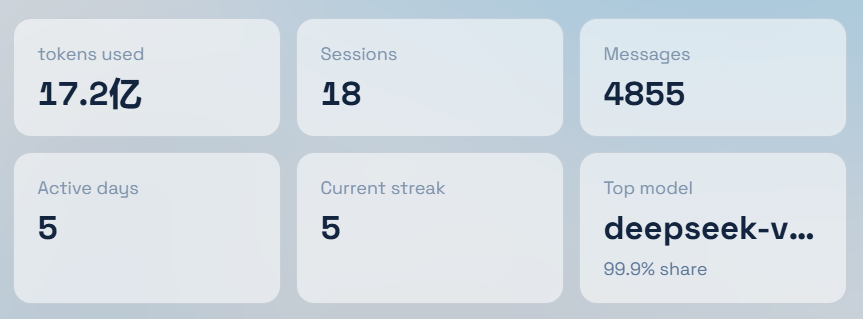
- Tokens used: total token consumption in the selected range;
- Sessions: sessions active in the range;
- Messages: total messages in the range;
- Active days: days with any activity in the range;
- Current streak: consecutive active days up to today (GitHub-style);
- Top model: the model that consumed the most tokens in the range, with its share (%).
The header offers a time-range switch (Last 7 days / Last 30 days) and a Refresh button (forces a fresh recomputation, bypassing the cache).
Block 2 — Model usage (per-model totals)
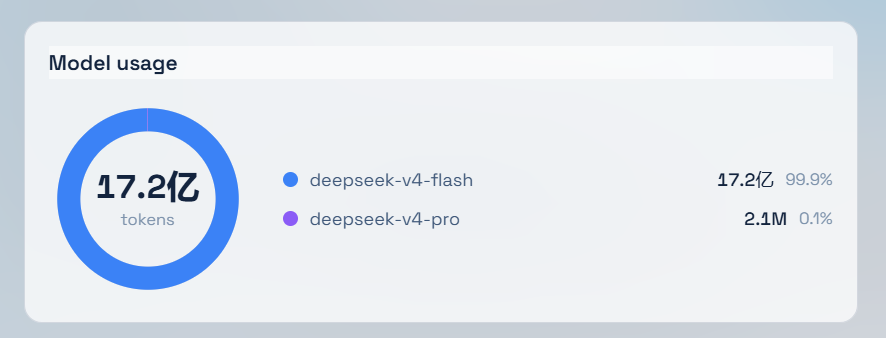
- A donut of the total token consumption in the range;
- A legend on the right: model name, tokens and share (%). Same-named models across providers are merged into one row.
Block 3 — Activity heatmap
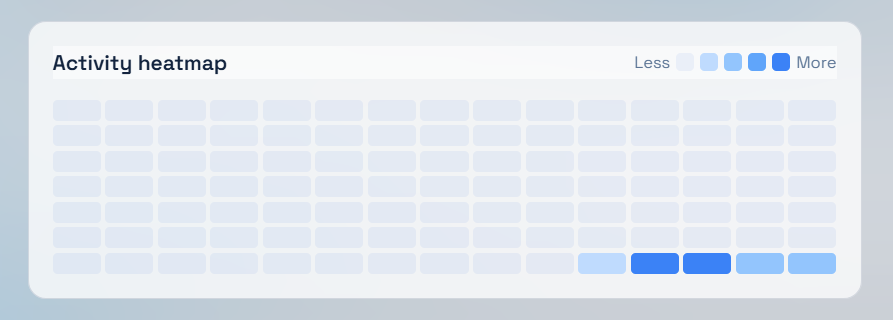
- A 15-week × 7-day matrix in GitHub-contribution style;
- Cell shade scales against the highest-token day in history: ≥75% darkest, ≥50% next, ≥25% mid, >0 light blue, no activity blank (legend "Less → More").
Block 4 — Daily token trend
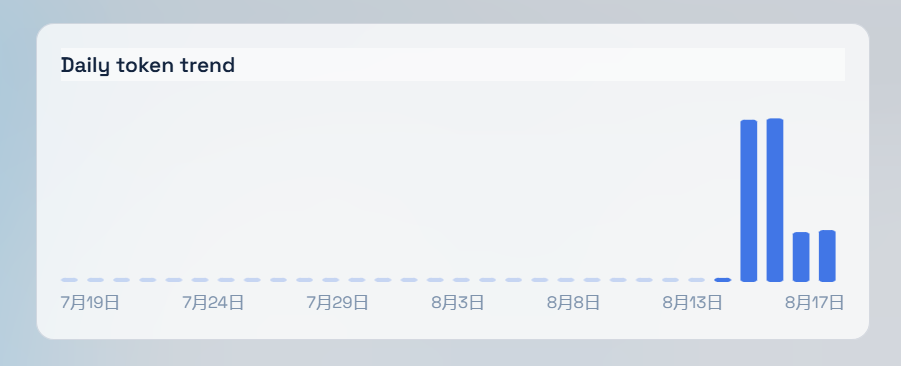
- A bar chart of tokens per day within the selected range (hover for the exact value), with auto-labeled date ticks.
Statistics are computed from your local persisted session logs (~/.dsh/sessions) — nothing is uploaded.
Manual install
Prerequisites (all must hold):
- A working DSH Web (
dsh web) reachable athttp://127.0.0.1:3080; - You can locate the DSH data dir:
%USERPROFILE%\.dshon Windows,~/.dshelsewhere (written as~/.dshbelow); - Network access to this repository (or a local copy).
Option A — one-command install (recommended, no npm, no build)
In mainland China, use the Gitee mirror instead:
https://gitee.com/chill109/dsh-strength-meter(swap the repo URL in the commands below).
Windows (PowerShell):
powershell -ExecutionPolicy Bypass -Command "Invoke-WebRequest 'https://github.com/chou109/dsh-strength-meter/raw/main/install.ps1' -OutFile install.ps1; .\install.ps1"
macOS / Linux / WSL (bash):
bash <(curl -fsSL https://raw.githubusercontent.com/chou109/dsh-strength-meter/main/install.sh)
The installer does three things (idempotent — safe to re-run):
- puts the source into
~/.dsh/plugins/dsh-strength-meter(zip download or git clone); - creates a junction (Windows) / symlink (macOS·Linux) in
~/.dsh/profiles/node_modules; - registers the
dsh-strength-meterentry in~/.dsh/profiles/web/cordis.patch.yml.
Option B — manual, three steps (offline environments / to understand the wiring)
- Get the source:
git clone https://github.com/chou109/dsh-strength-meter.git(or download the zip) anywhere, e.g.~/.dsh/plugins/dsh-strength-meter; - Link it (the loader resolves plugins from
~/.dsh/profiles):# Windows (junction, no admin rights) New-Item -ItemType Junction -Path "$env:USERPROFILE\.dsh\profiles\node_modules\dsh-strength-meter" -Target "$env:USERPROFILE\.dsh\plugins\dsh-strength-meter"# macOS / Linux (symlink) ln -s ~/.dsh/plugins/dsh-strength-meter ~/.dsh/profiles/node_modules/dsh-strength-meter - Register: append to
~/.dsh/profiles/web/cordis.patch.yml:- insert: - id: dsh-strength-meter name: 'dsh-strength-meter'
Last step: restart the dsh web process — a page refresh is not enough for a newly added plugin (the plugin set is snapshotted at boot; an already-open tab keeps its old boot manifest):
# Ctrl+C the running dsh web, then run it again
dsh web
Verify the install (in order, after the restart):
- Settings → Usage stats: the navigation entry appears and the page renders (six metric cards, donut, heatmap, trend);
- Browser DevTools → Network:
/plugins/dsh-strength-meter/client.jsand/plugins/dsh-strength-meter/usage.jsonboth return 200.
If any check fails, see the "If you are an AI, read this" debugging table, or send the screenshot to the AI that deploys it for you.
Let an AI deploy it for you
Paste this prompt to your AI assistant (Gitee mirror is faster in mainland China):
Please deploy the dsh-strength-meter plugin from https://github.com/chou109/dsh-strength-meter.git (or the Gitee mirror, faster in mainland China: https://gitee.com/chill109/dsh-strength-meter.git) to my DeepSeek Harness web profile. Follow the "If you are an AI, read this" section of the README strictly.
If you are an AI, read this
Deployment
1. Get the source
git clone https://github.com/chou109/dsh-strength-meter.git ~/.dsh/plugins/dsh-strength-meter
# or use the installer (zip + symlink + registration in one shot)
bash <(curl -fsSL https://raw.githubusercontent.com/chou109/dsh-strength-meter/main/install.sh)
2. Link it into the profile's node_modules (the loader resolves plugins from ~/.dsh/profiles)
# Windows (junction, no admin rights)
New-Item -ItemType Junction -Path "$env:USERPROFILE\.dsh\profiles\node_modules\dsh-strength-meter" -Target "$env:USERPROFILE\.dsh\plugins\dsh-strength-meter"
# macOS / Linux (symlink)
ln -s ~/.dsh/plugins/dsh-strength-meter ~/.dsh/profiles/node_modules/dsh-strength-meter
3. Register the plugin (append to ~/.dsh/profiles/web/cordis.patch.yml, idempotent)
- insert:
    - id: dsh-strength-meter
      name: 'dsh-strength-meter'
4. Restart dsh web. The cordis plugin set is snapshotted at startup (per client-modules: "plugin-set changes take effect on restart"); HMR only refreshes bundle content of already-registered plugins.
5. Verify
GET http://127.0.0.1:3080/plugins/dsh-strength-meter/client.js→ 200, body starts withwindow.__ModuleLoader__.load({;GET http://127.0.0.1:3080/plugins/dsh-strength-meter/usage.json?days=30&force=1→ JSON withtotal / models[] / sessions / messages / activeDays / streak / topModel / byDay[] / heatmap[] / days;window.__DSH_BOOT__.entrieson the page contains{ id: "dsh-strength-meter", ... }.
Architecture
One cordis plugin, two faces:
dsh-strength-meter/
├── lib/index.js      # Host face (Node): usage aggregation + web route
├── lib/fold.js       # Pure fold (unit-testable): event log → per-model / per-day stats
├── lib/client.js     # Client face (browser), pre-built, committed to the repo
├── src/client/*.tsx  # Client sources (esbuild build, see scripts/build.mjs)
├── scripts/build.mjs # Self-contained build: esbuild(cjs) + __ModuleLoader__ wrapper
├── install.ps1 / install.sh
└── tests/            # fold unit tests + host/bundle smoke tests
Host face (lib/index.js)
- Depends on
webServer+sessions(declared in the entryinjectlist, the platform convention); registers an exact route/plugins/dsh-strength-meter/usage.json(exact routes win over client-modules'/pluginsprefix route, so no conflict). - Data sources, best-effort:
ctx.sessionPersistence(full history, optional):listSnapshots()returns{ header, revision }(the id lives onheader.id) → cold sessions are cached byrevision, only changed logs are re-folded;ctx.sessions(fallback): live sessions only.
- Fold rules (
lib/fold.js, aligned with token-meter semantics):request/headerdata.header.config.{provider,model}decides billing for subsequent samples (recorded at sample time, positionally correct);- usage samples:
assistant/chunkwithchunk.type === "usage", or theusagefield ofassistant/message; a message sample for the same(turn, step)replaces the chunk sample; - sum = input + cacheRead + cacheWrite + output; aggregated per model and per day (local timezone).
- Query params:
days=7|30scopes totals at the sample level (old data never leaks into the window);force=1bypasses the 15 s TTL cache. - Metrics: tokens / sessions / messages / activeDays / streak (full history) / topModel (with share %) / byDay[] / heatmap[] (15 weeks × 7 days, shade scaled against the peak token day).
- The payload carries a
debugblock (live/persisted counts and errors) for diagnostics.
Client face (src/client/)
- Entry
inject: ['slots','locale','sessions'], one slot registration:settings.section(root scope) →StatsSection: the full "Usage stats" page (metrics, donut, heatmap, trend), nav label from thenav.statskey.
- Same-named models across providers are merged into one row before rendering; shares are recomputed.
Bundle contract (mandatory, or the page boot fails)
window.__ModuleLoader__.load({ id: "dsh-strength-meter", factory: (require) => { /* CJS */ return module.exports } })
- The artifact must be pre-built (the repo ships
lib/client.js; installs never build); - Externals are limited to
react,react/jsx-runtimeand@deepseek-ai/*(resolved by the ModuleLoader's seed/static/factory tables); never bundle platform code; package.jsonneedsexports["./client"]and thedsh.clientdeclaration (copy from this repo'spackage.json);- The bundle's ModuleLoader id is read from
package.json'snameby the build script, so renames cannot desync it.
Debugging
| Symptom | Check |
|---|---|
| No "Usage stats" entry in Settings | Inspect window.__DSH_BOOT__ — if dsh-strength-meter is absent: not restarted, or not registered in cordis.patch.yml. If present: look at Network for /plugins/dsh-strength-meter/client.js (should be 200). |
| Page blank / all metrics zero | Read the debug block of usage.json: are live/persisted zero? What's in errors? If sessions:0, the host is probably running pre-fix code (old payloads lack the new fields). |
usage.json 404 | Host face didn't start: check the dsh log for errors around dsh-strength-meter: usage route; confirm webServer/sessions exist (they always do in the web profile). |
| Heatmap fully blank | Confirm usage.json's heatmap array is non-empty with some nonzero levels; hard-refresh the page (Ctrl+Shift+R) to load the new bundle. |
| White screen after editing the bundle | Rebuilt lib/client.js yourself? Run pnpm install then node scripts/build.mjs, or restore the committed artifact. |
Rebuilding the client (after touching src/client)
cd dsh-strength-meter
pnpm install        # first time only (renames/moves can break pnpm junctions — reinstall once)
node scripts/build.mjs
# writes lib/client.js (+ source map, handy for browser debugging)
Changing a registered plugin's bundle does not need a restart — a page refresh suffices (client-modules re-injects by content hash). If a pnpm run dev:web watcher is running on this machine, updates are hot. Host-side (lib/) changes do require a dsh web restart.
Tests
node tests/fold.test.mjs      # fold / window / heatmap unit tests (zero deps)
node tests/host.smoke.mjs     # route + usage.json smoke
node tests/bundle.smoke.mjs   # bundle-contract smoke (mocks __ModuleLoader__)
Operating / extending
- Copy:
src/client/locales.ts(Chinese is the key-set source of truth;enmust match the key set). - New stat dimensions: extend the fold in
lib/fold.js(event types come from thedsh-sessionlog vocabulary), then render inStatsSection; keep the verification field list in this README in sync. - Heatmap bucketing:
levelOfinlib/fold.js(currently 4 token-relative buckets against the historical peak day). - New slots: add another
ctx.slots.inject(...)registration insrc/client/index.ts; component props are{ t, ...injectedFace }. - No uploads: aggregation happens only on this machine (the Host face reads
~/.dsh/sessions).
License
MIT — see LICENSE.
Plugin correlati
DeepSeek-Balance-Whale-Widget
meteornox/deepseek-balance-whale-widget
dsh-context
bowenliang123/dsh-context
dsh-cost-meter
han-1413141/dsh-cost-meter
dsh-damage-pulse
wssfk12138/dsh-damage-pulse