dsh-net-dashboard
foreee/dsh-net-dashboard
Live network inspection dashboard in the sidebar: interfaces with IP/MAC, traffic rates, TCP/UDP session counts and latency curves, refreshed every 3 seconds. macOS only (the collectors run ifconfig, netstat, scutil and /sbin/ping).
Installazione
dsh plugin --profile web add github:foreee/dsh-net-dashboardREADME
dsh-net-dashboard
A live network inspection dashboard in the DeepSeek Harness sidebar: interfaces and IP/MAC, traffic rates, TCP/UDP sessions, and latency curves, all read from this machine at request time and refreshed every 3 seconds.
English | 中文
What it does
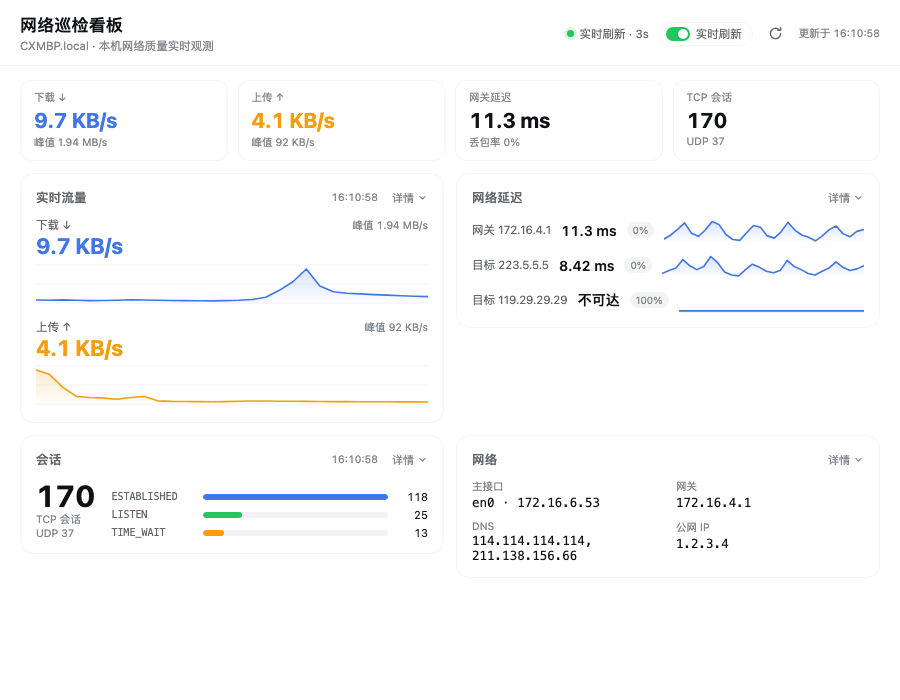
The panel sits under the built-in sidebar rows and shows the current machine's network quality. It is key-first: a KPI strip and four cards, each collapsed to its essentials with a 详情 (Details) disclosure.
- KPI strip — download rate, upload rate, gateway latency and TCP session count, always visible.
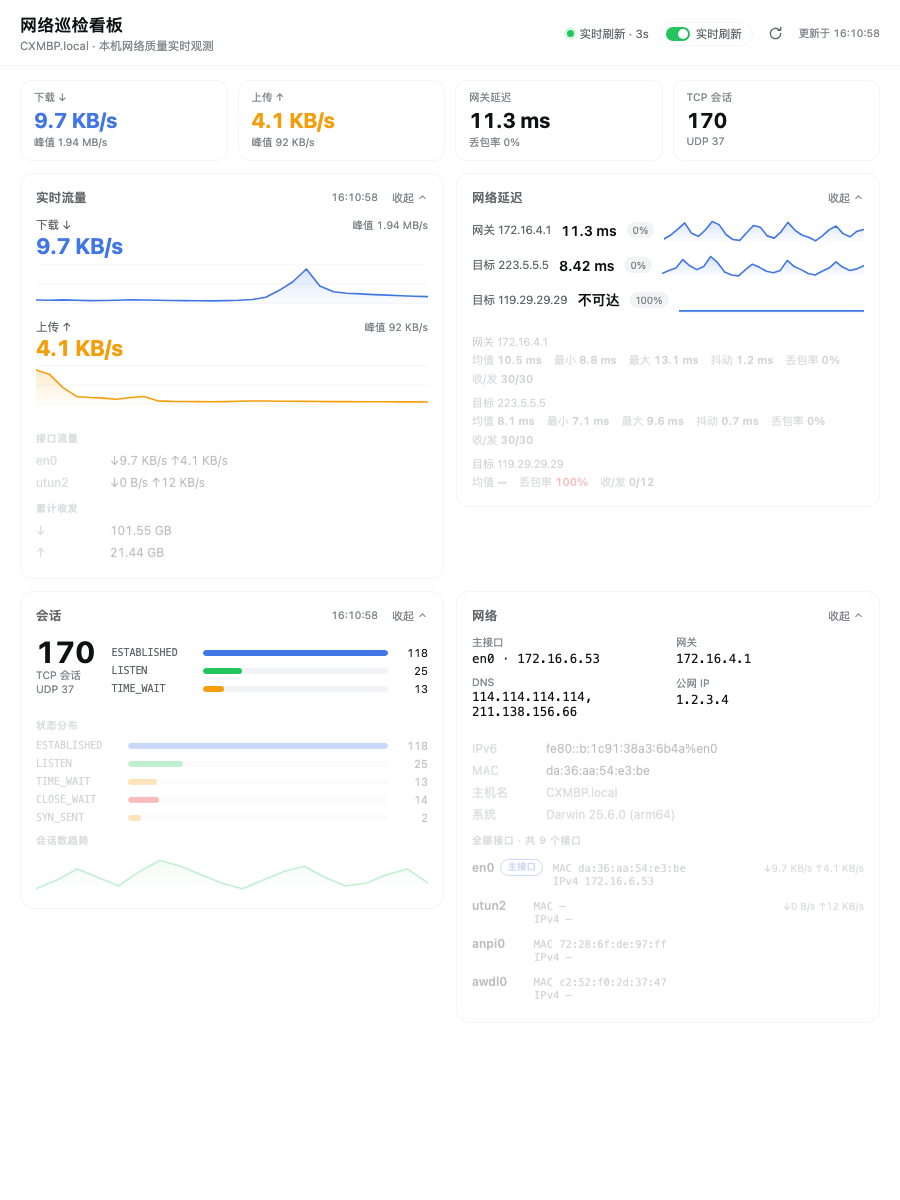
- Live traffic — aggregate download/upload rates (loopback excluded) with rolling curves and peaks. Details adds per-interface rates and cumulative in/out counters.
- Latency — one compact row per target: current value, loss chip and a 1-second-resolution mini curve. The default gateway is always followed; a public target is configurable. Details adds average / min / max / jitter / loss / received-sent statistics.
- Sessions — TCP session total, UDP socket count and the top state bars. Details adds the full TCP state breakdown and a session-count trend.
- Network — primary interface with IPv4, gateway, DNS resolvers and public IP at a glance. Details adds IPv6, MAC, Wi-Fi facts, hostname, OS version and a full interface table with live per-interface rates.
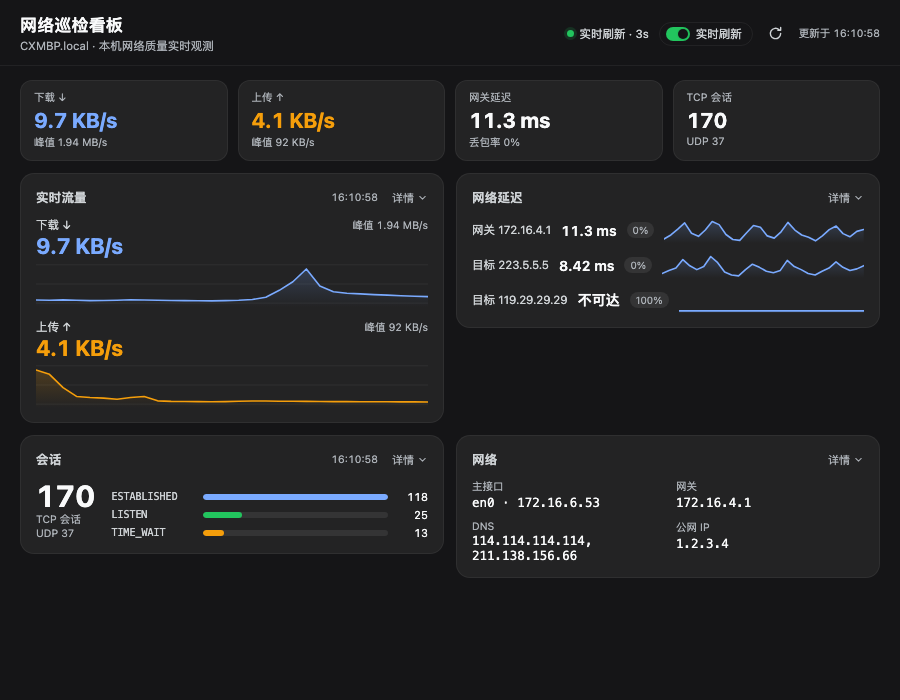
| Dark theme | Expanded details |
|---|---|
 |  |
Install
dsh plugin --profile desktop add "github:foreee/dsh-net-dashboard"
Use --profile web for the browser profile. The Web Plugins page and the plugin_manager tool accept the same address. The plugin ships plain JavaScript — no build step, no dependencies.
How it works
The host half (lib/index.js) mounts one loopback-only route, GET /api/net-dashboard/snapshot:
- Each request runs
ifconfig,route,netstatandscutil --dns(all bounded), plusipconfig getsummaryfor Wi-Fi facts. - Traffic rates come from diffing
netstat -ibbyte counters against the previous sample held in memory. - Latency is fed by persistent
ping -i 1child processes (one per target, restarted on failure, stopped with the plugin) into a rolling window; the route only reads that window, so a 3-second poll never spawns command storms. - The public IP lookup is cached for 10 minutes and can be disabled.
The browser half (lib/client.js) polls the snapshot every 3 seconds (toggleable, persisted in localStorage), keeps its own rolling history for the traffic and session curves, and draws every chart as inline SVG — no chart dependency. Colors use the shell theme tokens, so light and dark themes both work.
Routes
| Route | Method | Purpose |
|---|---|---|
api/net-dashboard/snapshot | GET | one full snapshot: interfaces, primary facts, traffic, sessions, latency |
The route sits behind a loopback-only trust fence (loopback socket and loopback Host header, same-origin markers enforced); paired remote devices are rejected.
Configuration
| Field | Default | Meaning |
|---|---|---|
enabled | true | set false to mount nothing |
pingTargets | ["223.5.5.5"] | extra latency targets; the default gateway is always followed |
publicIp | true | enable the cached public IP lookup |
Requirements and limitations
- The collector commands and parsers target macOS.
- Without Location permission macOS hides Wi-Fi SSID/RSSI; those rows are simply omitted.
- Traffic rates need two snapshots to materialize, so the first poll shows
—.
Development
node --test test/*.test.js   # parser, trust-fence and loopback-guard tests
node --check lib/index.js && node --check lib/client.js
License
MIT
Plugin correlati
dsh-web (dsh-task-board)
zhu1090093659/dsh-web
dsh-web (dsh-web-all)
zhu1090093659/dsh-web
dsh-TUI
ccch1mneyyy/dsh-tui
dsh-web-ui (dsh-task-board)
zhu1090093659/dsh-web-ui