agent-workflow-viewer
hgognav233-netizen/agent-workflow-viewer
Session canvas for DeepSeek Harness: draws the capabilities each session uses (files, terminal, web, MCP, skills, child tasks) and the objects they touched, highlights running and failed paths, and opens a detail panel with error text, estimated spend and a filterable timeline; reachable from the left navigation or beside the conversation input.
Installazione
dsh plugin --profile web add github:hgognav233-netizen/agent-workflow-viewerREADME
Agent Workflow Viewer
See what your Harness agent is doing while it works. A Workflow icon in the left navigation, below Plugins, opens a canvas of all sessions; ◇ Workflow beside the conversation input opens the same canvas focused on the current conversation. Both follow the Harness language and colour scheme.
Session canvas
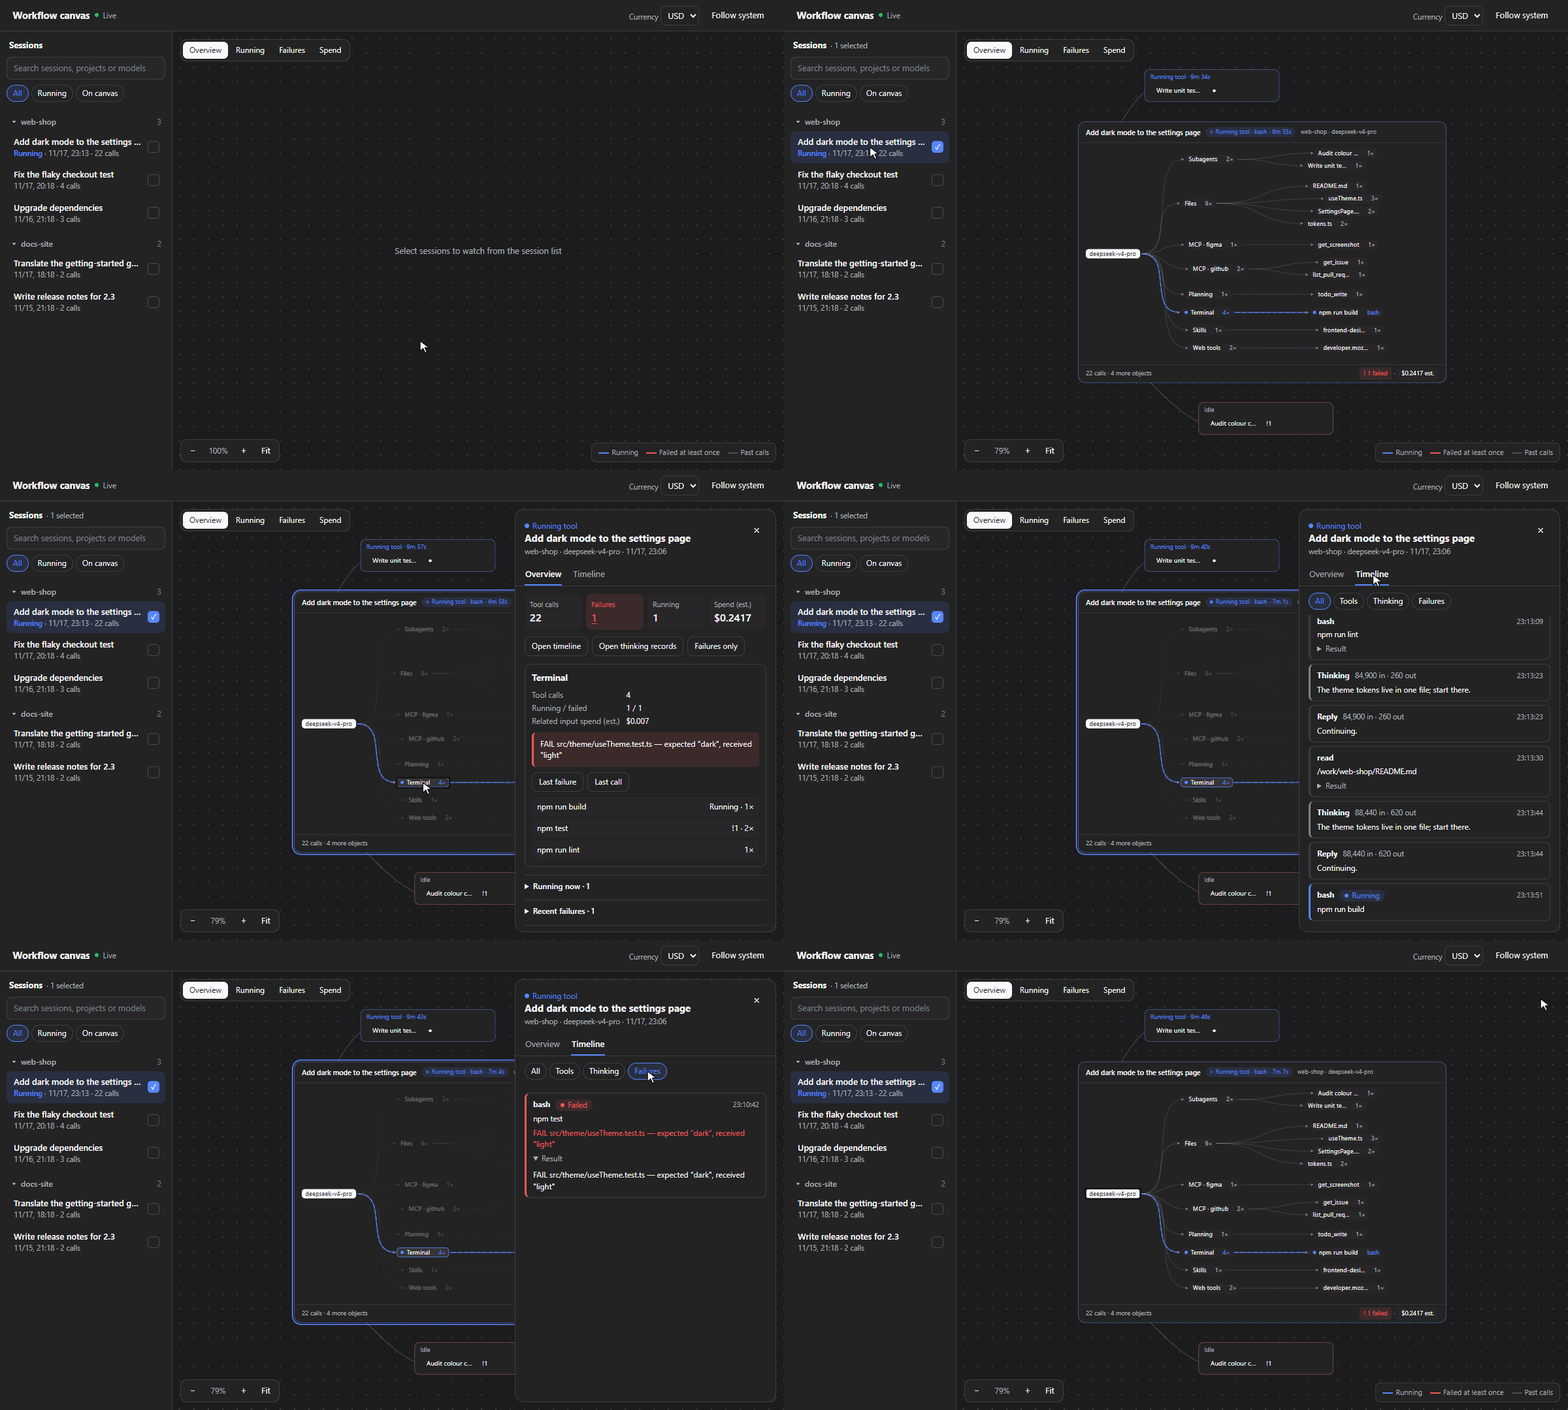
The left-hand icon opens a full page that is not bound to the open conversation:
- The session list follows the Harness sidebar: sessions are grouped by workspace, pinned sessions come first, then the most recently active, and titles are the ones the sidebar shows. Subagent and blank sessions are left out; archived sessions can be shown from the bottom of the list.
- Search by session, project, or model, or filter the list to running sessions or sessions on the canvas.
- Select or drag a session to put its card on the canvas. Each card shows the full title, its state, the model, its capabilities, and the objects they touched. Drag a card's header to move it, drag the background to pan, and scroll to zoom. Fit brings every card into view.
- Running paths use the Harness accent colour and failed paths are red. Switch between overview, running calls, failures, and estimated spend.
- Child tasks appear around their parent session. Select one to expand its workflow on the same canvas.
- Select a session, capability, or object to open the detail panel. Overview shows totals, running calls, recent failures, the most expensive model requests, and child tasks; Timeline shows the session's records.
- The browser remembers the selection, moved cards, collapsed workspaces, and whether archived sessions are shown.
Open /agent-workflow/canvas directly while signed in to DSH Web. In DSH Desktop, Open in browser creates a two-hour link for the system browser that shows the same information as the canvas inside Harness. Switch estimated spend between USD and CNY in the header; the CNY view shows the reference rate and its date.
Install
Install version 0.4.1 from GitHub in the DSH Web profile:
dsh plugin --profile web add github:hgognav233-netizen/agent-workflow-viewer#v0.4.1
In DSH Desktop, open Plugins and paste the Git source:
git+https://github.com/hgognav233-netizen/agent-workflow-viewer.git#v0.4.1
Enable the bundle, restart the Harness host, and choose Workflow in the sidebar.
To try the development version, clone this repository and install the checkout as a local bundle. Pass the absolute checkout path to the Plugins page or the plugin manager's install_bundle action. Restart the Harness host after changing index.js and reload the interface after changing client.js.
Use the viewer
- Overview (detail panel) shows tool calls, failures, running calls, and estimated spend, with lists of running calls, recent failures, the most expensive model requests, and child tasks. Select an entry to open it in the timeline.
- Timeline shows messages, the model's reasoning, tool calls with their status and results, and turn boundaries. Filter by all, tools, thinking, or failures, page through older records, and return to the latest.
- Spend (estimated) prices each model request from the public API list with peak and off-peak rates. Tools that share one request cannot be split further, and this is an estimate rather than a bill.
- Coordination calls such as
subagentorwait_agentare shown as actions ("Start child task", "Wait for child task"); the child sessions themselves are drawn as branches. MCP tools are grouped as MCP · server name.
Counts reflect the latest 3,000 events owned by a session. The timeline shows up to 400 matching entries per page. Inside Harness the canvas uses the Harness language and changes with it; a browser link carries the language it was opened in; otherwise the browser language decides.
The former single-session page, /agent-workflow/view?root=…, now opens the canvas focused on that session.
Data and access
The plugin reads Harness session logs and serves the canvas and timeline through the Harness web server. It does not modify logs or send them to another service. Responses can contain message excerpts, the model's reasoning text, tool results, local paths, or command summaries. Review screenshots and diagnostics before sharing them. Spend is estimated by the plugin from the public price list; Harness itself records no money.
Activity routes request authenticated Harness access. The browser link from DSH Desktop works only on a loopback address, expires after two hours, and carries its key in the address fragment, which browsers do not send to servers or in referrers. Anyone with the link on this computer can read the same records as the canvas, so do not share it. On older hosts without route admission, a peerless request is allowed only through a loopback listener with a local authority and no cross-site browser context. Harness Web Server documentation
Contribute
Run the tests with Node.js 22 or 24. The tests use the built-in runner and synthetic session logs.
npm test
The host projection is in index.js, the canvas page is in canvas.js, and client.js places it in the Harness interface. To report a problem, open an issue with your Harness version, operating system, and the steps needed to reproduce it. Use a synthetic or redacted session when attaching examples.
Plugin correlati
billion-context
ranxianglei/billion-context
dsh-web-ui (dsh-chat-recovery)
zhu1090093659/dsh-web-ui
dsh-synapse
liangmianya/dsh-synapse
dsh-archive-manager
michengai/dsh-archive-manager