dsh-keelwatch
kute/dsh-keelwatch
Watches installed DSH bundles for load failures and dependency drift, brakes repeatedly failing tools, and attributes token cost per message source.
Installazione
dsh plugin --profile web add github:kute/dsh-keelwatchREADME
dsh-keelwatch
English | 中文
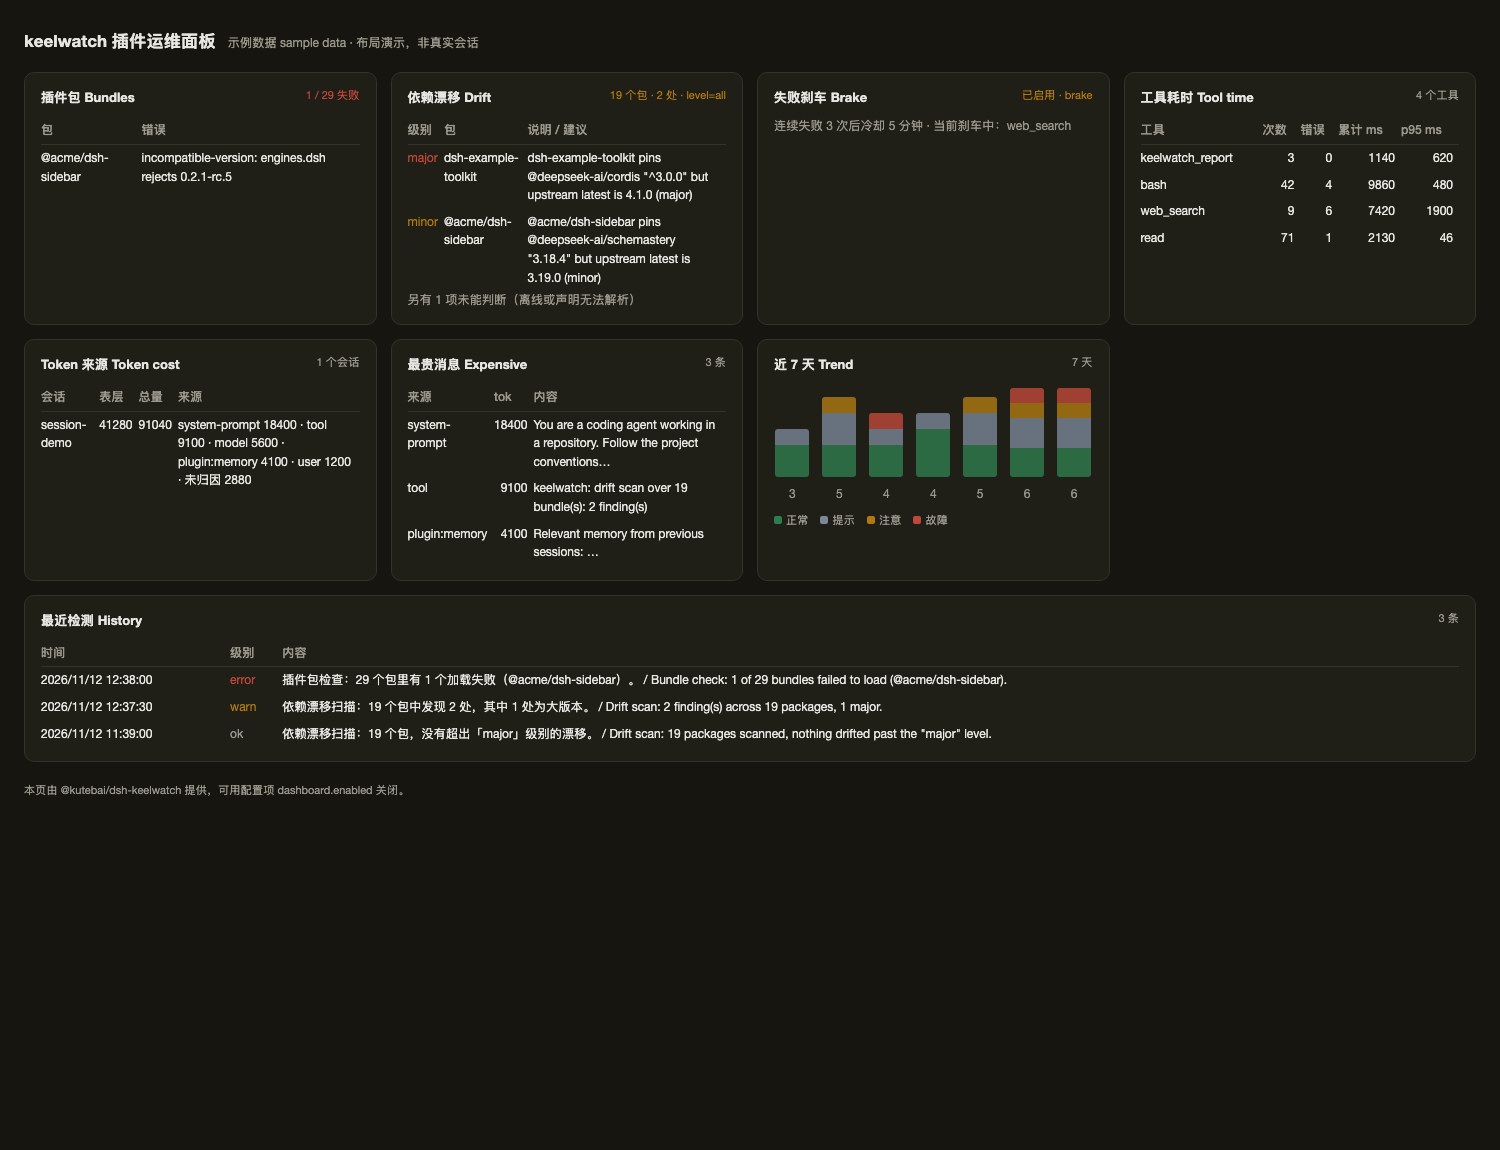
The image above uses the dashboard's sample-data mode (
?demo=1) to show the layout; a live page shows your own sessions.
The operations layer for a DeepSeek Harness (DSH) plugin ecosystem. Once you install a dozen plugins, you need something that watches them. keelwatch adds no agent capability — it fixes three concrete problems:
| Problem | What you see | What keelwatch does |
|---|---|---|
| A plugin silently stops working | DSH starts fine, but a capability is gone | Reads every bundle's load result and reports the exact package that failed |
| Upstream moved, next reinstall breaks | Works today, breaks after an upgrade | Compares declared dependency ranges against the registry and grades the drift (major / minor / patch) |
| One broken tool gets retried forever | Tokens burn, turns get slow | Counts consecutive failures per tool, then denies further calls with a cause-specific next step (not just "no"). User cancellations are never counted |
| Token cost is a mystery | Big bills, no attribution | Attributes surface tokens per source (user / model / tool / plugin:xxx) and lists the most expensive individual messages |
First, what is a bundle?
A DSH profile (~/.dsh/profiles/<name>/) is a composition of plugins. The unit you install is a bundle: one npm package plus a config patch (cordis.patch.yml) that inserts several plugin rows into your profile. So "a plugin is broken" can mean the package failed to load, or one row is misconfigured. The bundles: line in the report is the package layer; row is the config layer.
Install
# 1) from npm (recommended: prebuilt, no build authorization)
dsh plugin --profile <profile> add @kutebai/dsh-keelwatch

# 1b) tarball from the GitHub release
dsh plugin --profile <profile> add ./kutebai-dsh-keelwatch-0.2.0.tgz

# 2) straight from the repository (build output is committed, no build授权 needed)
dsh plugin --profile <profile> add github:kute/dsh-keelwatch

# 3) local development (directory link; rebuild + restart after changes)
pnpm build
dsh plugin --profile <profile> add /path/to/dsh-keelwatch
In the DSH plugin market: there is no central index — add this URL under Plugins → Discover → Add index source:
https://kute.github.io/dsh-keelwatch/index.json
Requires engines.dsh: >=0.2.1-0 <0.3.0-0 (covers DSH 0.2.1.x / 0.2.2.x), Node >=22.19, all platforms.
Configuration
Two ways, same result:
- Web GUI — Plugins →
@kutebai/dsh-keelwatch→ the configuration section (screenshots from a real install, with the sidebar cropped and paths shortened to~). Saving validates the values, writes only this plugin's row into the profile patch (after backing the file up), and lets the Loader reload it. - YAML — edit
~/.dsh/profiles/<profile>/cordis.patch.ymldirectly.
- id: keelwatch
  config:
    driftRadar:
      enabled: true
      checkIntervalHours: 24     # 0 = scan at startup only
      alertLevel: major          # major | minor | all
      whitelist: []
      registryUrl: ''            # empty = the configured npm registry
      requestTimeoutMs: 8000
    failureBrake:
      enabled: false             # off by default: record only
      action: log                # log | brake
      maxConsecutiveErrors: 5
      cooldownMinutes: 10
      tools: []
      exclude: []
      neverBrake: [ask_user_question]
    costAttribution:
      enabled: true
      retentionDays: 7
      topN: 10
      toolToBundle: {}
    dashboard:
      enabled: false        # opt-in: serves /keelwatch/dashboard
      refreshSeconds: 30    # 10-600
Dashboard (opt-in, off by default)
Turn it on in the plugin config page, or in YAML:
dashboard:
  enabled: true       # default false
  refreshSeconds: 30  # 10–600
Turn it on and a "open dashboard ↗" link appears in the plugin's Dashboard card (it carries the GUI token). Or open /keelwatch/dashboard?token=<GUI token> directly — the page is standalone, not a section in the sidebar.
The page shows bundle health, dependency drift with fix suggestions, brake state, per-tool latency (calls/errors/total/p95), token cost by source with the most expensive messages, a 7-day stacked trend chart (coloured by ok/info/warn/error; silent days keep an empty column), and recent history.
Both routes guard themselves with a same-origin check (the host's /api fence does not cover custom paths): a request carrying an Origin header that does not match the served host gets 401, which blocks a page in the browser from reaching localhost. Local CLI tools (no Origin) pass, since a local process can read your files anyway.
The host does not expose the GUI token to plugins (getAdvertisedUrl() returns the origin without it), so no token comparison happens today; the code keeps that branch ready should the host start providing one. It is plain HTML — no client build, no dependency on the client plugin loading — and turning the switch off unregisters both routes.
How detection runs
| Check | When |
|---|---|
| Bundle health (any failed load?) | 5 s after startup, then on every checkIntervalHours |
| Dependency drift | At startup, then every checkIntervalHours |
| Failure brake | Real time: counted after each call, enforced before the next |
| Token / latency | Accumulated in real time, summarised on demand |
checkIntervalHours (default 24, 0 = startup only) is the single frequency knob.
How you get told
- Logs — serious findings also go to
stderr(e.g.~/Library/Logs/dsh-web.err.log), so they survive without opening a session. - Plugin page — a recent detections list with time, level, and a bilingual line per entry.
- Chat —
keelwatch_reportfor the full report plus a conclusion.
It never injects monitoring noise into your conversation: push costs context, pull is cleaner.
Where the history lives
| Where | What |
|---|---|
| Plugin page → recent detections | Last 20 entries: time, level, ZH + EN |
~/.dsh/keelwatch/history.jsonl | Raw records (kind/level/en/zh/detail/at) |
GET /keelwatch/history?limit=50 | Same data over HTTP (needs the GUI token) |
Pruned by costAttribution.retentionDays (default 7) and capped at 500 entries.
The report
keelwatch_report                                    # status (default)
keelwatch_report action=disable bundle=<pkg name>   # turn off a broken bundle
Every section carries an EN: and a ZH: reading, and the report ends with a single Conclusion that tells you whether to act:
[1] Bundles 插件包            29 tracked, no load errors
[2] Dependency drift 依赖漂移 19 scanned, 2 findings (minor)
[3] Failure brake 失败刹车    disabled in configuration
[4] Tool time 工具耗时        per tool: calls, errors, total, p95
[5] Tokens 上下文成本          surface / total per session, by source kind
[6] Conclusion 结论           nothing to fix today
Notes on reading it:
bundlesis the package layer (including shipped-but-disabled bundles);driftscans packages whosepackage.jsonis actually on disk, so the counts differ.no findingswithalertLevel: majoronly means nobody crossed a major boundary — setallto see minors.unattributedtokens are messages that predate keelwatch: attribution starts recording when the plugin loads, and the host offers no supported way to read history events retroactively.
What it deliberately does not do
No timeouts (the host's dsh-tool-call-timeout-policy owns them), no repeat-call reminders (the host's dsh-repeat-tool-reminder owns them), no killing in-flight calls (DSH cancellation is cooperative), no source modification, no replacement of the tool executor, no separate web UI, no health grades.
Attribution accuracy
| Dimension | Accuracy |
|---|---|
| Session total, context pressure | Exact (host ctx.tokenMeter) |
| Tokens per message source kind | Exact for events observed after keelwatch loaded |
| Per-tool latency and error rate | Exact |
| Attribution to an npm package | Inferred: exact only when a plugin declares its own MessageSource.kind |
Development
pnpm install
pnpm build      # tsc -> lib/ ; browser half src/client/index.js -> lib/client.js
pnpm test       # node --test test/*.test.mjs (110 checks)
pnpm market     # regenerate docs/index.json (plugin market index)
Three test layers, one of which runs the real framework: test/e2e-cordis.test.mjs mounts the plugin in a real Cordis context so inject = ['timer','tools'] is resolved by the framework itself, then dispatches the tools/* waterfalls — the only layer that catches a wrong inject name or a throwing registration.
timer is a static inject; dsh-base ships @deepseek-ai/cordis-plugin-timer (row id timer), so web / headless / sdk profiles all provide it. A profile that removed it simply does not load this plugin, which is what a declared dependency should do.
Verification and rollback: VERIFY.md, scripts/rollback.sh.
License
MIT
Plugin correlati
deepseek-harness
deepseek-ai/deepseek-harness
dsh-market
dsh-market/dsh-market
dsh-web (dsh-plugin-manager)
zhu1090093659/dsh-web
dsh-web
zhu1090093659/dsh-web