dsh-usage-peak
hhse/dsh-usage-peak
Peak/valley pricing and spend dashboard for DeepSeek Harness, with a sidebar pill showing today's spend and tokens plus a details page with hourly, 14-day and per-model breakdowns.
Install
dsh plugin --profile web add github:hhse/dsh-usage-peakREADME
用量峰谷仪表盘(DSH Usage Dashboard)
给 DeepSeek Harness 用的用量/花费仪表盘:一眼看清现在是不是峰时、今天花了多少钱、烧了多少 tokens,以及钱到底花在缓存、全价输入还是输出上。
全部在本地读取 DSH 自己的会话日志,不联网、不上报。
效果
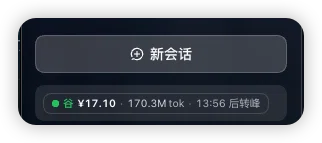
侧栏常驻一行:峰/谷、今日花费、tokens、距离下次切价的时间,一眼看完。
功能
- 侧栏常驻胶囊:
● 峰 ¥14.70 · 12.8M tok · 2:43 后转谷,点一下打开完整面板。侧栏折叠时收成一个小圆点。 - 峰谷状态:当前时段、距离下次切换的倒计时、当前时段单价(缓存命中 / 全价输入 / 输出)。
- 今日概况:花费、请求数、tokens、缓存命中率、峰时花费占比、余额。
- 今日 24 小时分布:每小时花费柱状,峰时与谷时用不同颜色,当前小时高亮。
- 花费构成:缓存命中 / 全价输入 / 输出 三段占比,直接看出钱花在哪。
- 近 14 天趋势:按天堆叠柱状,可对照峰时占比判断"贵在哪天"。
- 按模型:Flash / Pro 各自的请求数、tokens、花费。
- 价目表:当前时段那一行高亮,方便解释账单。
设置页里的入口是「用量仪表盘」,侧栏胶囊就是同一份数据的浓缩版。
价格模型
单位:元 / 百万 tokens,[谷时, 峰时]。
| 模型 | 缓存命中 | 全价输入 | 输出 |
|---|---|---|---|
| DeepSeek Flash | 0.02 / 0.04 | 1 / 2 | 4 / 8 |
| DeepSeek Pro | 0.15 / 0.30 | 4.5 / 9 | 13.5 / 27 |
峰时 = 周一至周五 09:00–12:00、14:00–18:00(北京时间);其余时间、周末与节假日为谷时,单价减半。
数据来源
~/.dsh/sessions/<项目 slug>/<会话 id>/session.v4.jsonl.zstd:每条assistant/message的usage(输入、缓存读取、输出)与模型,按请求发生的时刻判断峰谷。~/.dsh/.dshw-usage.json:鲸鱼记账本的余额与当日花费,用作交叉校验。
日志是多帧 zstd,Node 自带的 zlib.zstdDecompressSync 只解第一帧,所以插件内部按 zstd magic 切帧、逐帧解压再拼接(不需要 zstd 命令行)。
快照缓存 15 秒;面板上的「刷新」按钮会带 ?fresh=1 强制重算。
安装
dsh plugin add github:hhse/dsh-usage-peak
(npm 同名包发布后,也可以直接按名字安装。)
装好后:
- 侧栏图标列表最上方出现用量胶囊;
- 设置 → 用量仪表盘 打开完整面板。
兼容性
- DeepSeek Harness 0.2.1-rc.3(见
package.json的dsh.compatibility.dshReleases)。 - Node.js >= 22.15(需要
zlib.zstdDecompressSync)。 - 纯 JS,无构建步骤:
client.js直接用window.__ModuleLoader__注册,require('react')由宿主提供。
已知限制
- 依赖 DSH 会话日志的内部格式(
session.v4.jsonl.zstd与assistant/message.data.usage)。DSH 改格式时需要跟进;读不到数据时面板会显示为空态而不是报错。 - 只统计本机会话日志覆盖到的历史,鲸鱼记账本从 2026-11-02 才开始记账。
许可
MIT
English
A usage and cost dashboard for DeepSeek Harness. It reads the local session logs (session.v4.jsonl.zstd) and the whale ledger, then shows:
- a persistent sidebar pill with peak/valley state, today's spend, tokens and the countdown to the next price switch;
- a details page (Settings → Usage dashboard) with KPIs, an hourly breakdown, cost composition, a 14-day trend, a per-model table and the price list.
Pricing ([valley, peak], CNY per million tokens): Flash cache-hit 0.02/0.04, miss 1/2, output 4/8; Pro cache-hit 0.15/0.30, miss 4.5/9, output 13.5/27. Peak hours are 09:00–12:00 and 14:00–18:00 Beijing time on weekdays; everything else is valley (half price).
Everything stays local — no network calls, no telemetry. Multi-frame zstd logs are decoded frame by frame with Node's built-in zlib, so no zstd binary is required.
Related plugins
DeepSeek-Balance-Whale-Widget
meteornox/deepseek-balance-whale-widget
dsh-context
bowenliang123/dsh-context
dsh-cost-meter
han-1413141/dsh-cost-meter
dsh-damage-pulse
wssfk12138/dsh-damage-pulse