dsh-workload-report
tableau-china/dsh-workload-report
DeepSeek Harness (DSH) plugin — see your effort and token usage by date and workspace: calendar heatmap, time-of-day analysis, workspace share, and a shareable self-contained HTML report.
Install
dsh plugin --profile web add github:tableau-china/dsh-workload-reportREADME
TimeMirror for DSH · Workload Report
Put your effort and your token spend on the same picture: see where your time went and where the tokens went, by date and by workspace — calendar heatmap, time-of-day analysis, workspace share, and a one-click self-contained HTML report you can send straight to a client. A DeepSeek Harness (DSH) plugin for effort & token insights.
TimeMirror is a macOS time-distribution app I published on the Mac App Store; this plugin brings the same idea to AI-assisted work — the time you and your AI spend, and what it costs, made visible. The package/repo uses the descriptive name
dsh-workload-reportso it can be found in the DSH ecosystem; the brand stays TimeMirror.


中文 · English
What problem it solves
You use AI every day, but you cannot say where the work went or what it was worth:
- Self-review: which project did the last 30 days actually go to? Which hours am I sharpest?
- Reporting to a client or your team: not "I've been busy", but "this project took 46.2% of my effort, 3.74 B tokens, and I was on it 18 of the last 30 days."
- Blog posts / monthly reports: a calendar heatmap plus time-of-day analysis is made to be screenshotted.
DSH itself only shows a stats line for the current session; the cross-session, cross-project, cross-time view is what this plugin adds.
Not just cost — the work behind it. Cost meters tell you what you spent; this plugin also tells you what you did: how many days you showed up, which hours you were sharpest, and which project your effort actually went into. That is the part you can put in front of a client.
Features
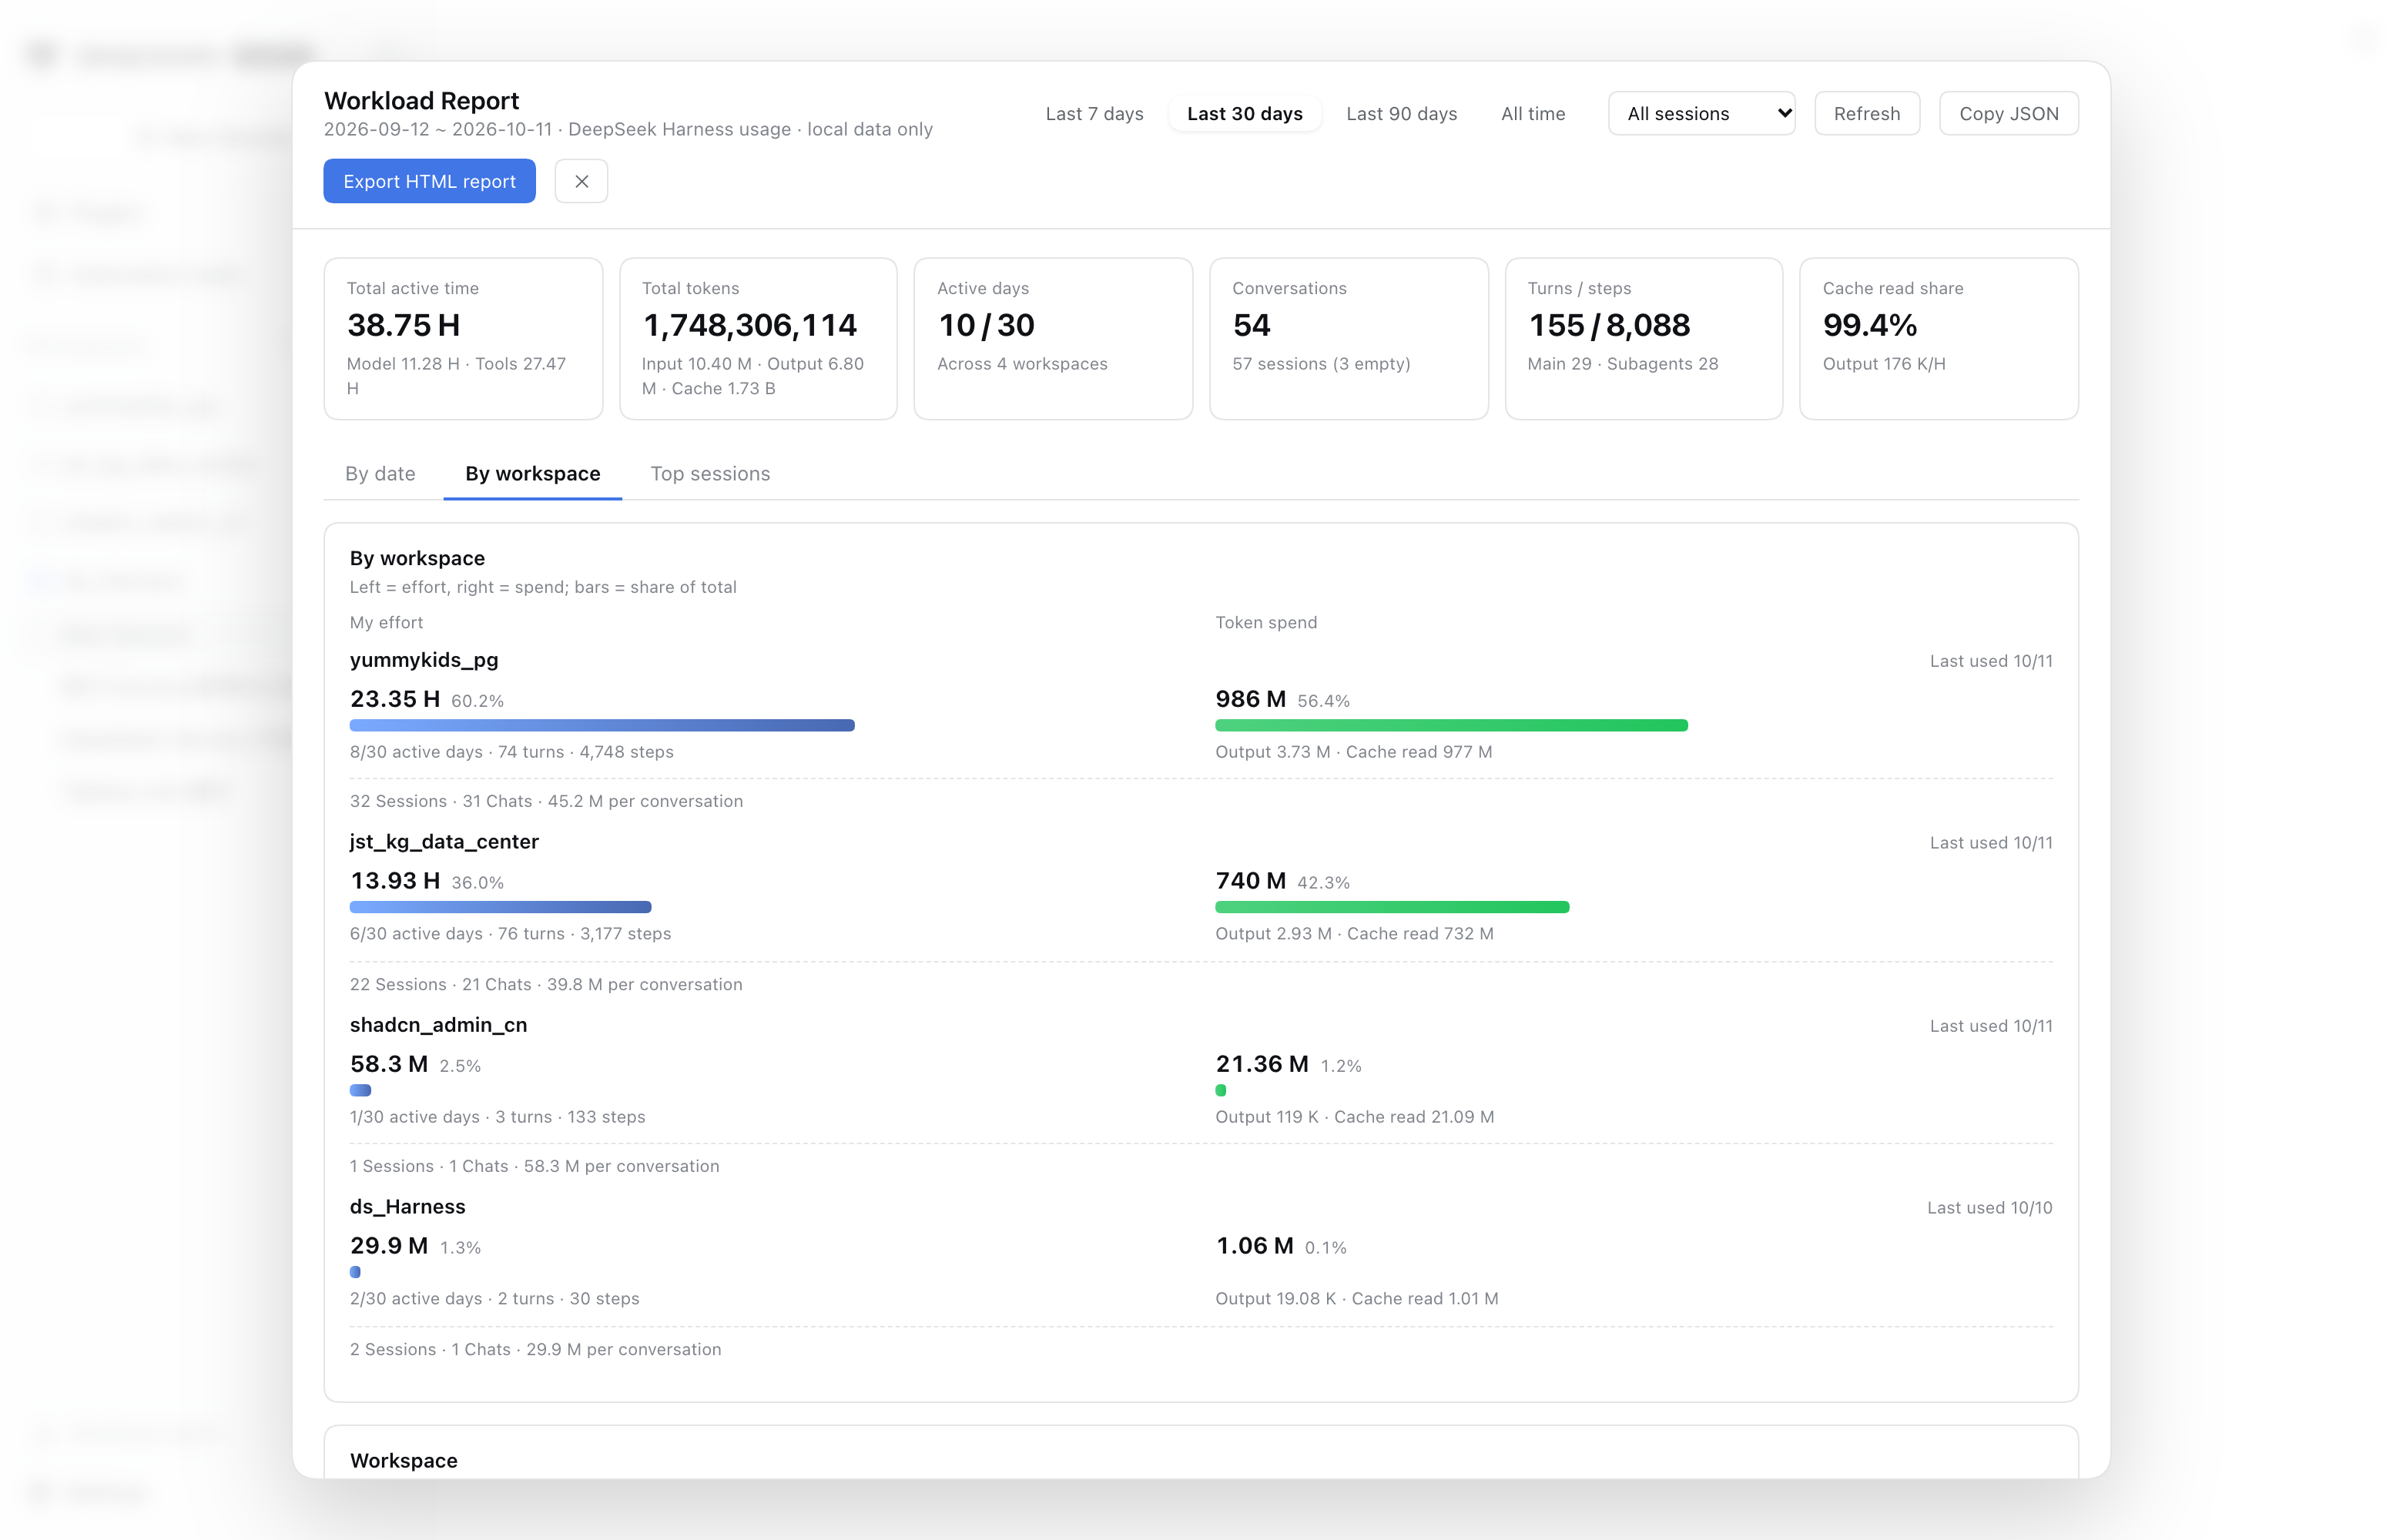
- ✅ Effort vs. spend per workspace: each row shows "My effort" on the left (active time + active days + turns/steps) and "Token spend" on the right (total + output/cache). Both bars use the same scale, so they compare directly.
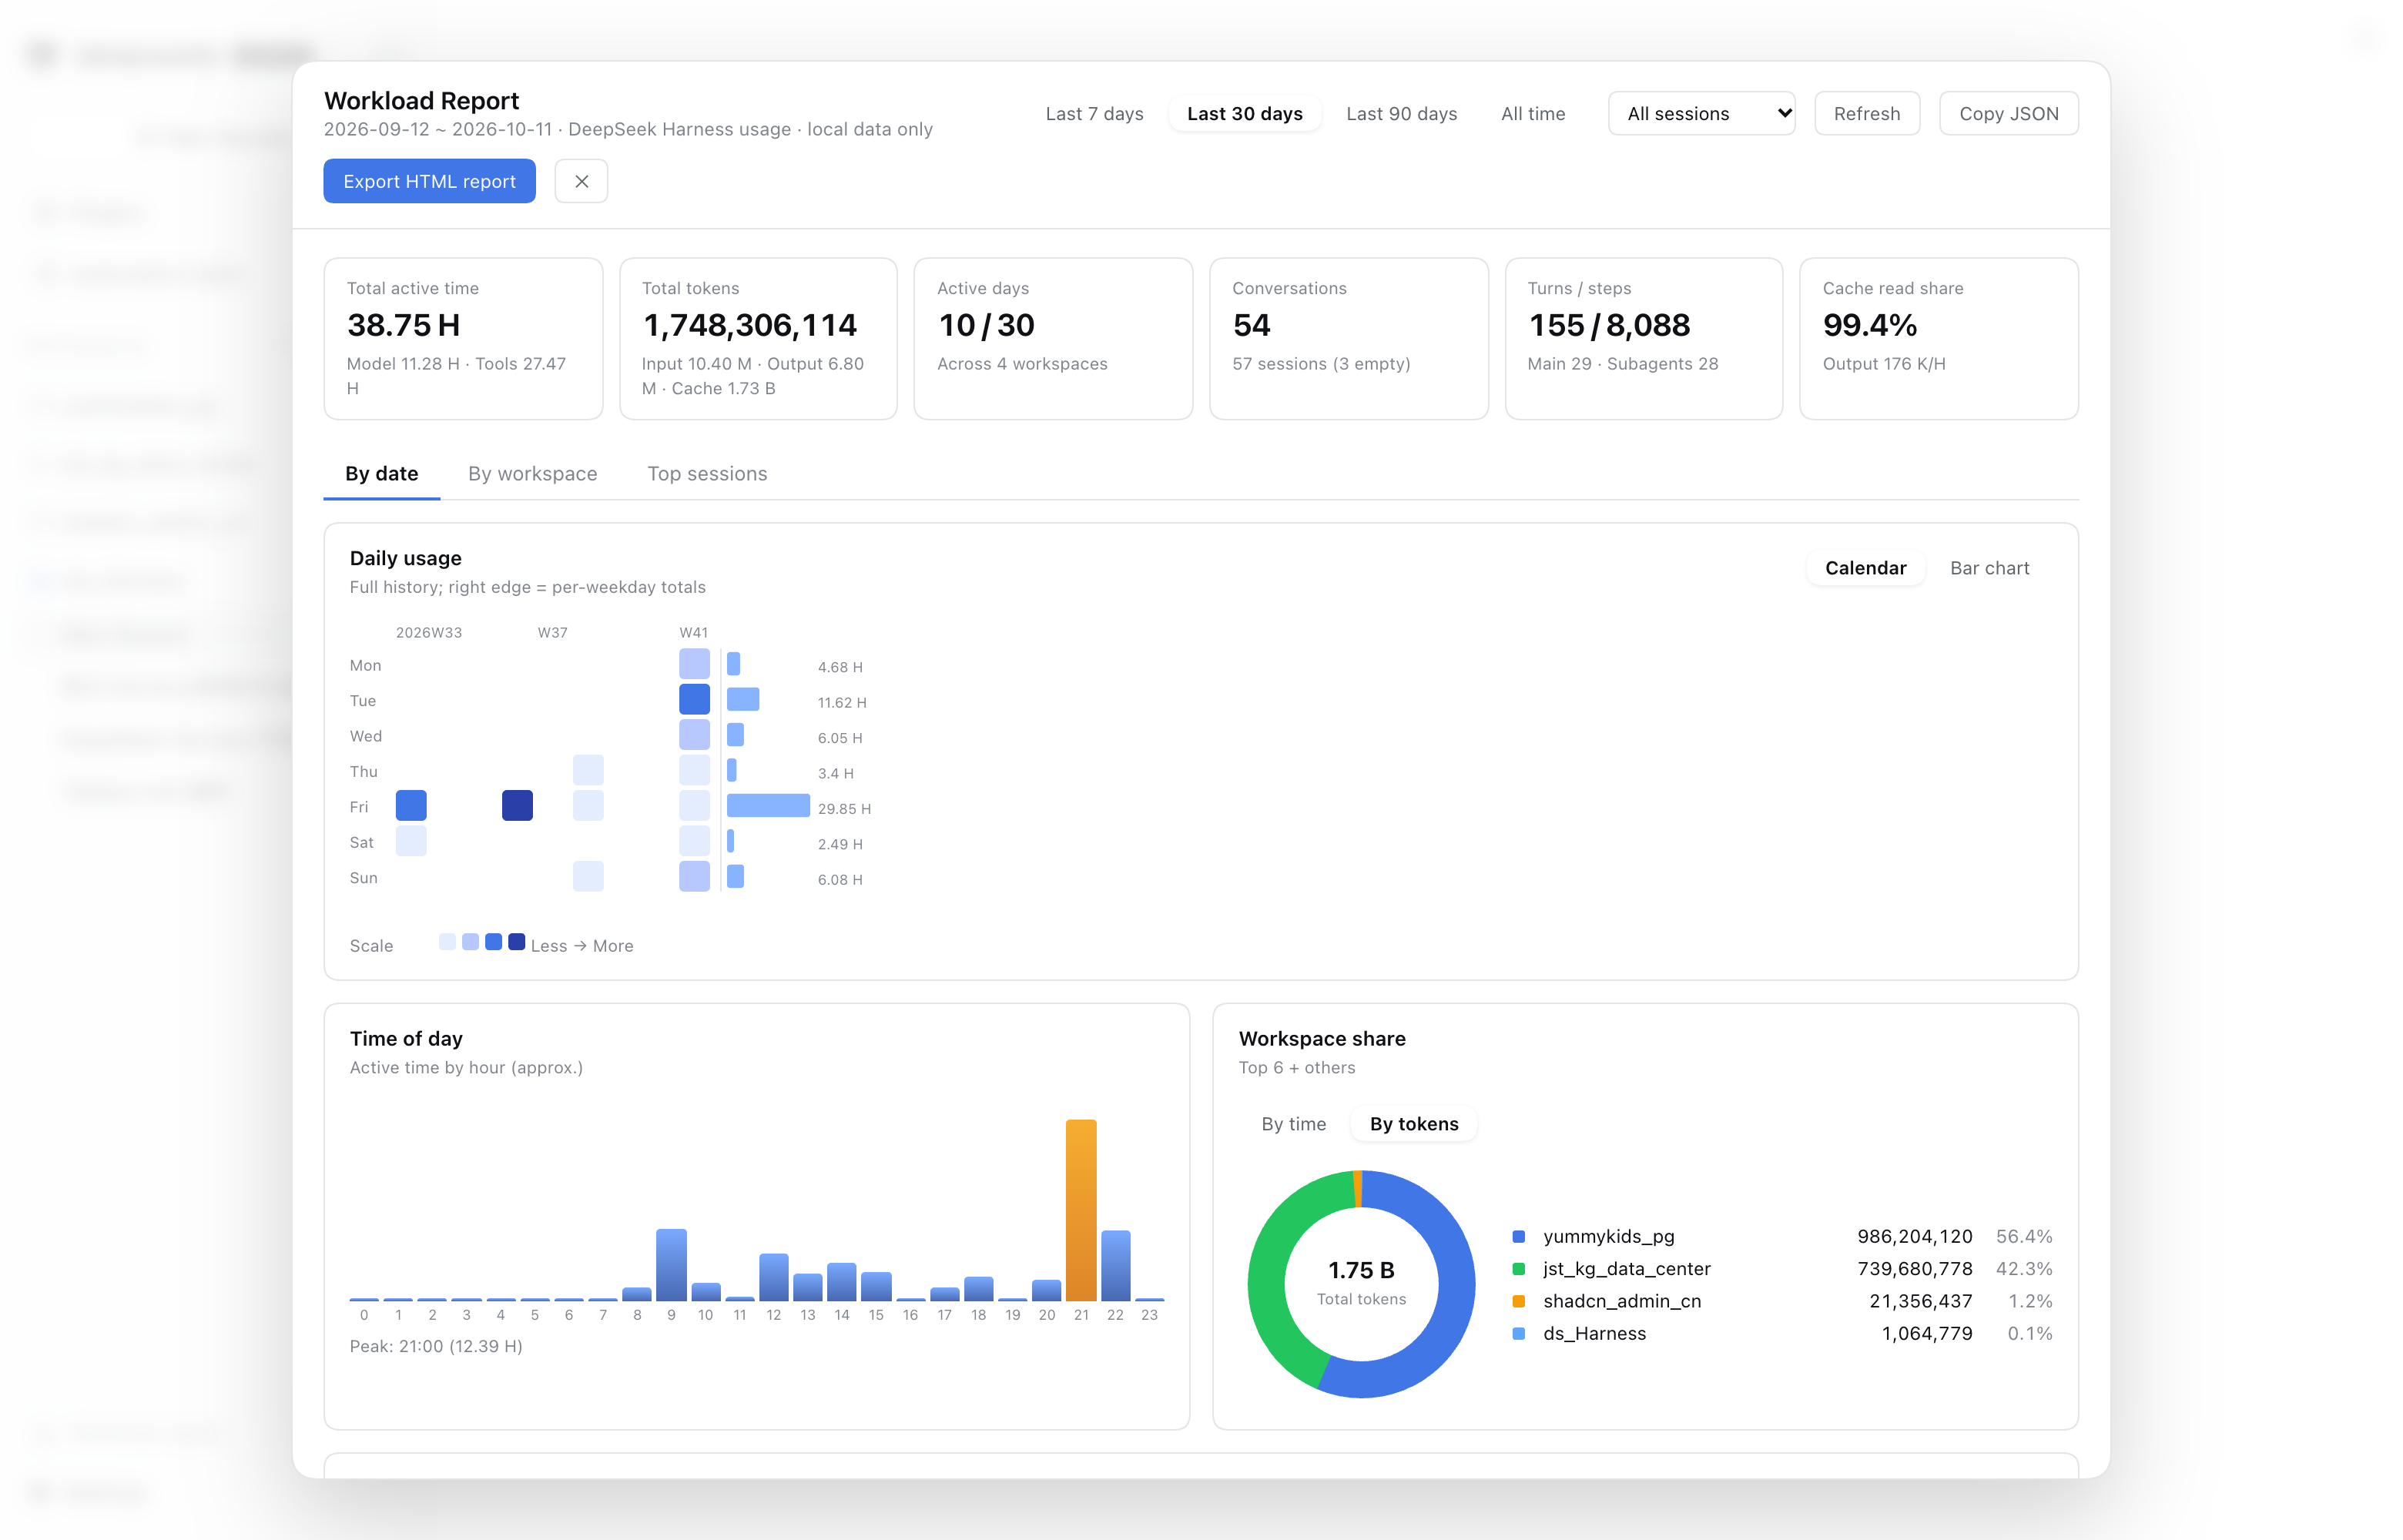
- ✅ Calendar heatmap: rows Mon–Sun, columns Year-Week, colour = active time. It always shows the full history, with 7 per-weekday totals glued to the right edge — you can see at a glance which weekday you are busiest.
- ✅ Time-of-day analysis: who is active from 0–23, with the peak hour highlighted (definition: each session's active window is spread across the covered hours by wall-clock share).
- ✅ Workspace donut: Top 6 + others, switchable between time and tokens.
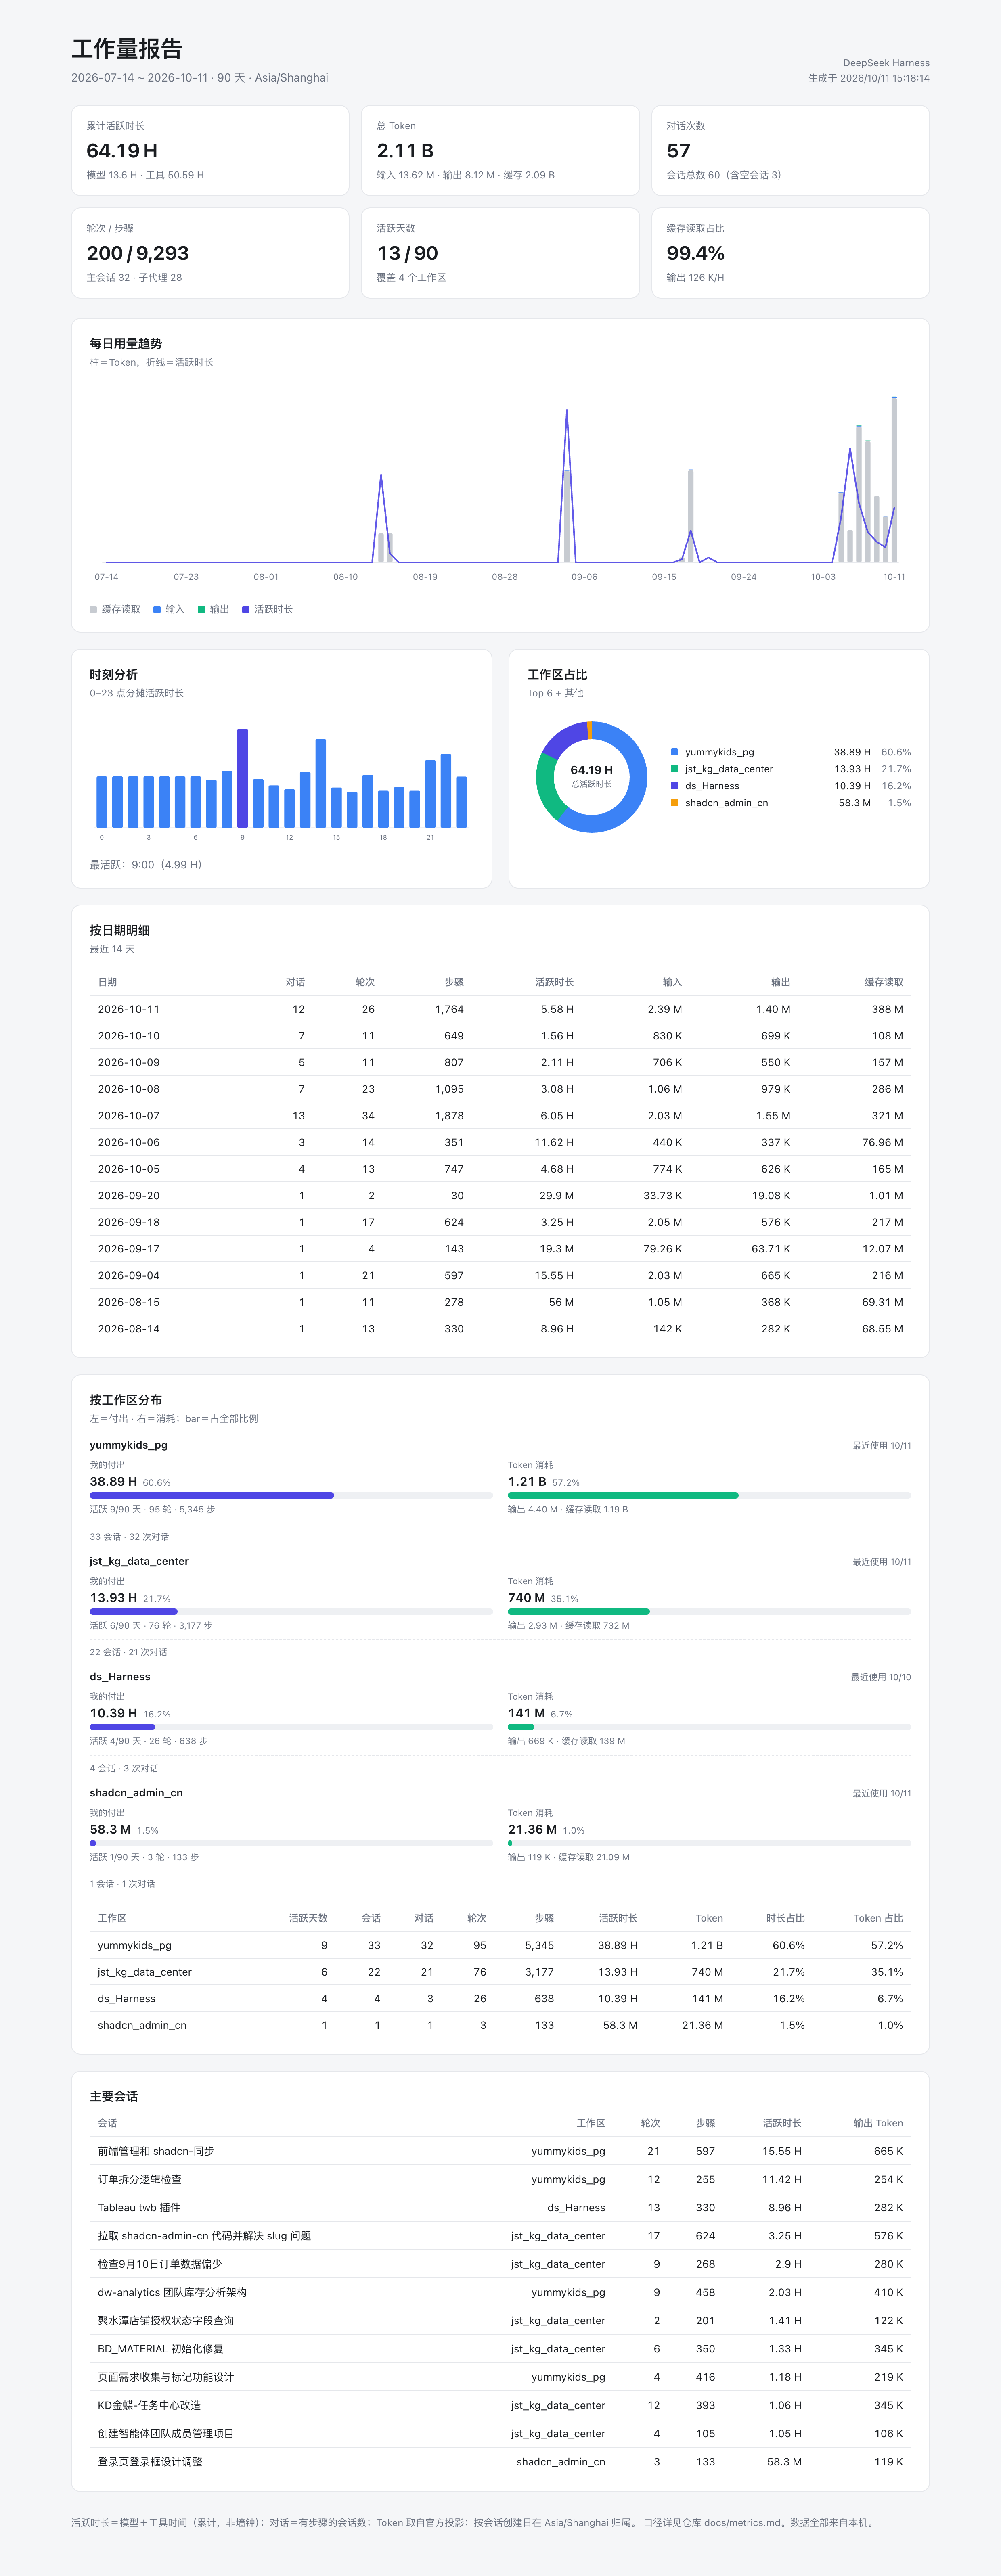
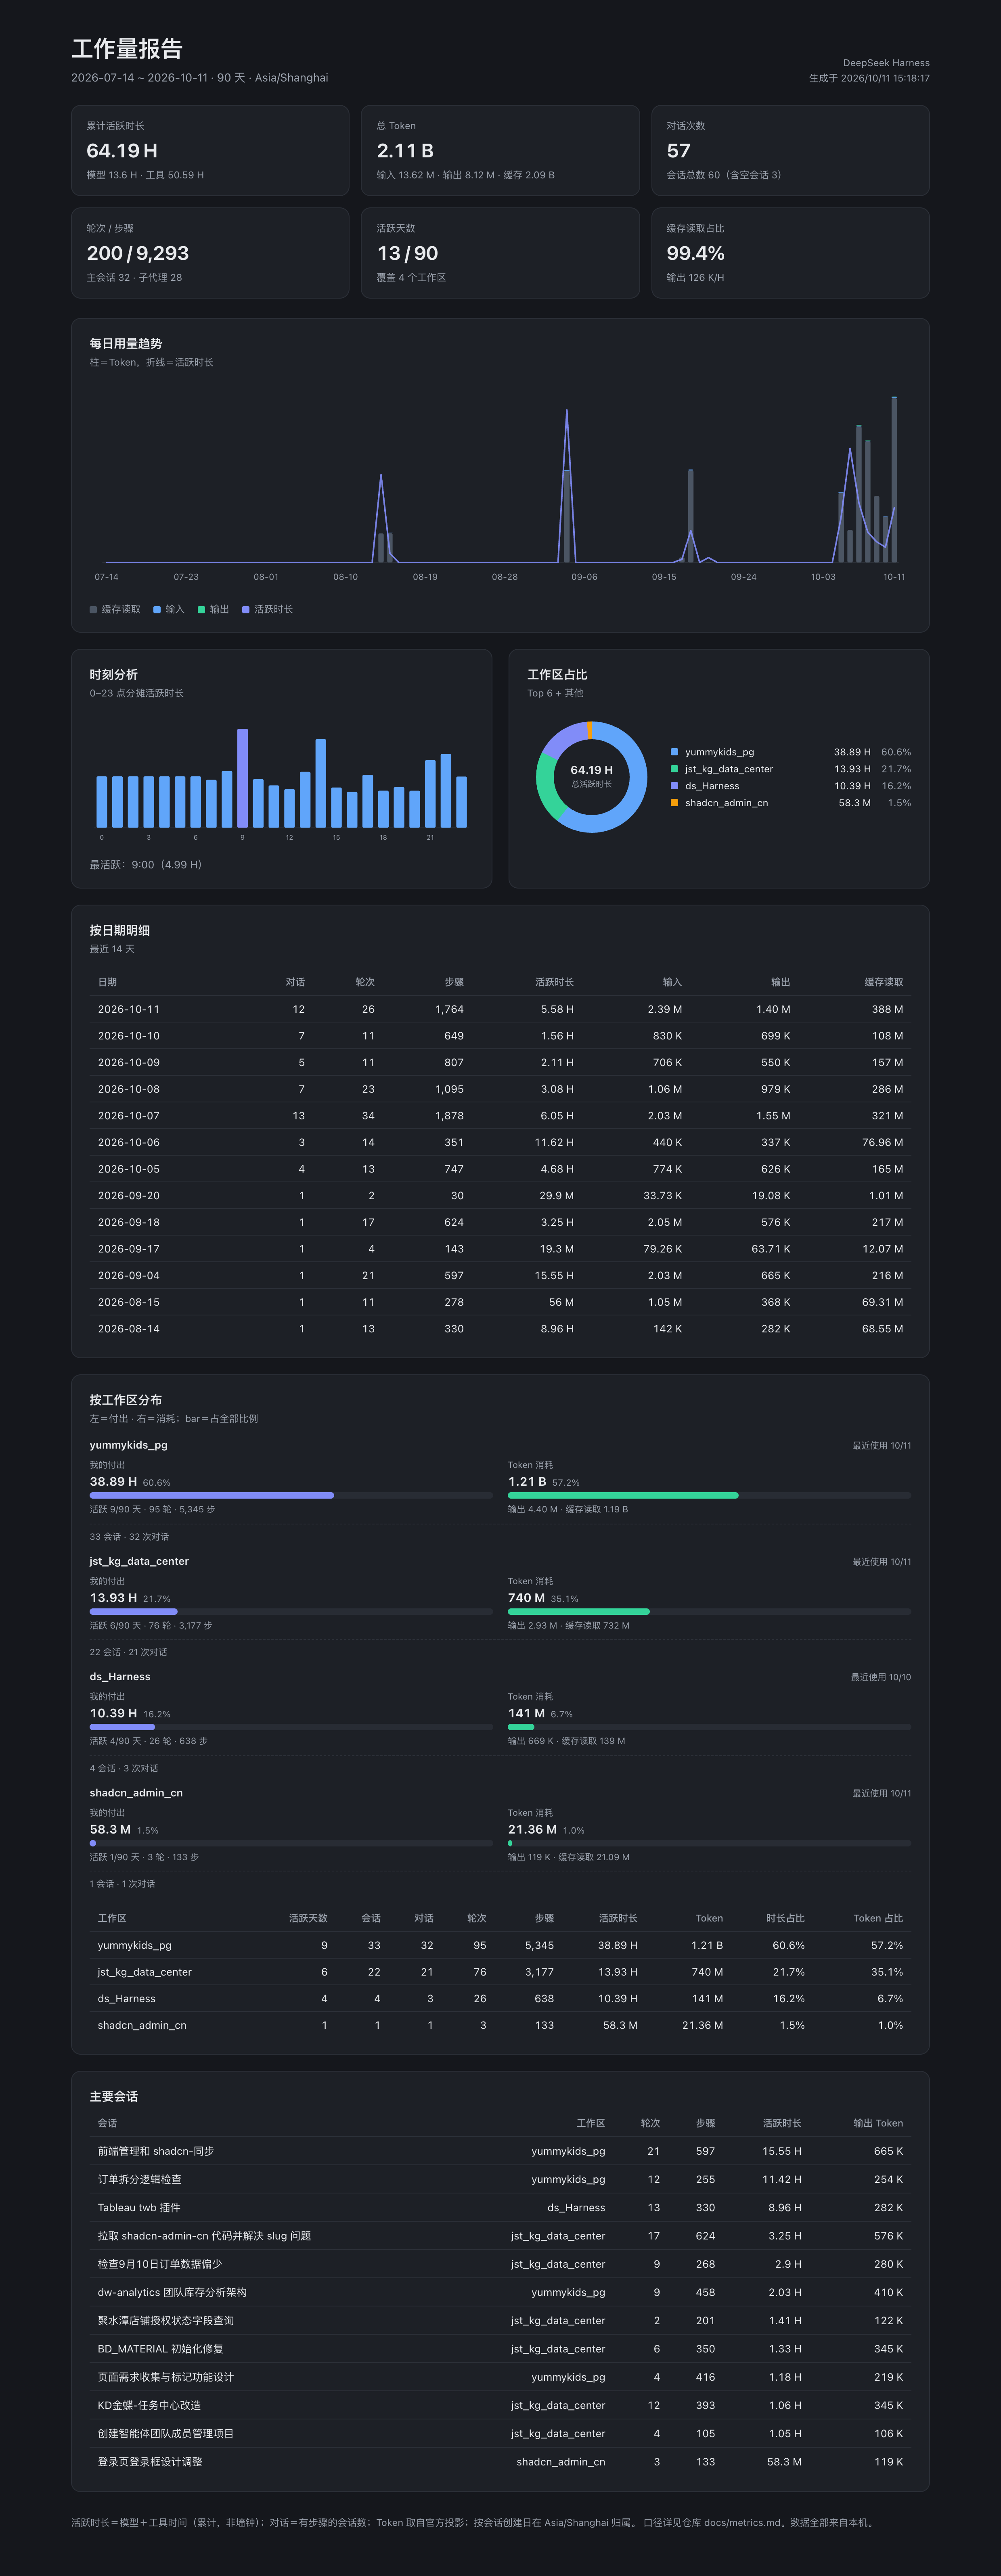
- ✅ Shareable HTML report: a single file with inline CSS and inline SVG, no scripts and no external links; light/dark themes, custom title and note, and
anonymize=1to hide workspace names and session titles. - ✅ Six KPIs: active time / total tokens (as a full integer you can verify) / active days / conversations / turns·steps / cache-read share.
- ✅ Official interfaces only: no log-format parsing, no business data written, no outbound requests. Values come from zero-I/O projection-checkpoint reads, with an official cold-read fallback and a reusable local index.
- ✅ Theme and locale aware: every colour comes from host theme tokens (
--dsw-*), so it follows the harness's light/dark theme and Chinese/English locale.
Screenshots
Home: six KPIs + calendar heatmap (switchable to a bar chart) + side-by-side time-of-day analysis and workspace share + a collapsed daily table
By workspace: effort on the left, token spend on the right, two bars on one scale
The exported report (single file, safe to send to a client)
Dark-theme report
Install
1. Straight from GitHub (recommended)
dsh plugin --profile web add github:tableau-China/dsh-workload-report#main
The built client bundle (lib/client.js) is committed, so no local build is needed. Restart the Web profile afterwards — a "Workload report" entry appears at the bottom of the sidebar.
2. Link a local checkout
cd /path/to/dsh-workload-report
dsh plugin --profile web add link:$PWD     # points the profile at your source tree
3. From npm
dsh plugin --profile web add dsh-workload-report
Published on npm: https://www.npmjs.com/package/dsh-workload-report If your npm client points at a mirror (e.g. npmmirror), a brand-new package can take a few minutes to appear — use option 1 if you are in a hurry.
Uninstall: dsh plugin --profile web remove dsh-workload-report.
Configuration
Override any of these in your profile's cordis.patch.yml (all optional):
- id: workload-report
  name: dsh-workload-report
  config:
    apiPath: /workload-report/v1        # read-only API prefix
    defaultDays: 7                      # default range
    defaultScope: all                   # all | main | subagent
    defaultTitle: Workload Report       # report title
    workspaceAliases:                   # display names (very handy for client-facing reports)
      my-shop-app: Retail Order System
      data-platform: Data Platform
Read-only API
| Route | Description |
|---|---|
GET {apiPath}/snapshot?days=30&tz=Asia/Shanghai&scope=all | Aggregated snapshot JSON (totals / byDay / byWorkspace / byHour / bySession / calendar / diagnostics) |
GET {apiPath}/export.json?... | Same payload, sent with content-disposition for download |
GET {apiPath}/report.html?days=90&theme=dark&anonymize=1&title=... | Self-contained HTML report |
GET {apiPath}/health | Index diagnostics (session count, checkpoint hits, cold reads, read failures, duration) |
Parameters: from/to (YYYY-MM-DD, take precedence over days), days, all=1 (earliest active day → today), tz (IANA time zone), scope.
Metric definitions
The full definitions live in docs/metrics.md. Durations are always shown in H / M / S (language-neutral, like K/M/B for tokens, so one format serves every locale). The three most misunderstood:
- Active time = model time + tool time. It is cumulative engine work, not wall-clock time; concurrent sessions and subagents each add up.
- Conversations = sessions with at least one step. Zero-step sessions (opened but unused) are listed separately.
- Attribution date = the session's creation day in the selected time zone; a session resumed across midnight still counts on its creation day.
Privacy
All statistics stay on your machine. The plugin registers read-only HTTP routes only: no outbound requests, no telemetry, no user content collected.
The single file it writes is its own index cache at <DSH_HOME>/workload-report/index-v*.json — delete it and the plugin rebuilds by cold-reading; nothing else in your harness data is touched.
Whether the exported HTML report contains session titles is your call (anonymize=1 hides them).
Development
| Command | Purpose |
|---|---|
pnpm add -D esbuild puppeteer-core | Install build and E2E dependencies (or point ESBUILD_PATH / WL_PUPPETEER_DIR at existing installs) |
node build.mjs | Bundle src/client/ into lib/client.js (ModuleLoader factory format) with esbuild |
node test/verify.mjs | 124 offline assertions: aggregation semantics, time zones, hour-spread conservation, "all-time" start, calendar data source, HTML escaping, both token shapes, cold-read fallback, inject declaration check, host routes |
./test/e2e-boot.sh 3299 | Boot an isolated instance (own DSH_HOME and port, copied projection data) without touching your running GUI |
node test/e2e-ui.mjs | 61 real-browser assertions: calendar/bar switching, side-by-side geometry, weekday bars, donut switching, collapsed detail, report export |
CI runs build.mjs + verify.mjs, and fails if the committed lib/client.js differs from a fresh build.
Compatibility
- DSH
0.2.x, includingalphaprereleases (developed and verified against@deepseek-ai/dsh@0.2.1-alpha.2): the plugin only depends on official interfaces (sessionProjections/sessionProjectionCache/sessionQuery) and Node built-ins, never on internal file formats — so it can follow new releases. Staying compatible with the latest alpha is one of this project's goals; breakages will be tracked in issues and the CHANGELOG. - The first launch cold-reads historical sessions whose projection checkpoints are missing (about 2 minutes for 300+ sessions on my machine, concurrency 8). During that pass the API returns progressively filled data with
indexing: true; once the index is persisted, restarts reuse it. - Very early v0-format sessions may not be migratable/readable by the current harness. They are excluded from the statistics and the UI reports how many.
Author
 |
XILEJUN — author of TimeMirror · Blog post (中文) |
License
Related plugins
DeepSeek-Balance-Whale-Widget
meteornox/deepseek-balance-whale-widget
dsh-context
bowenliang123/dsh-context
dsh-cost-meter
han-1413141/dsh-cost-meter
dsh-damage-pulse
wssfk12138/dsh-damage-pulse