dsh-client-ui-sidebar-perfmon
xmwengxing/dsh-client-ui-sidebar-perfmon
Real-time host performance monitor for the DeepSeek Harness right Sidebar: CPU / memory / swap gauges, a GPU clock and VRAM line, CPU / GPU / motherboard / drive temperatures, a sortable process table, and a keep-awake toggle for remote sessions — on Linu
Install
dsh plugin --profile web add github:xmwengxing/dsh-client-ui-sidebar-perfmonREADME
@xmwengxing/dsh-client-ui-sidebar-perfmon
Real-time host performance monitoring for the DeepSeek Harness right Sidebar: CPU, memory and swap gauges, GPU clock and VRAM, CPU / GPU / motherboard / drive temperatures, plus a sortable process table — on Linux, macOS and Windows.
English | 中文
What it does
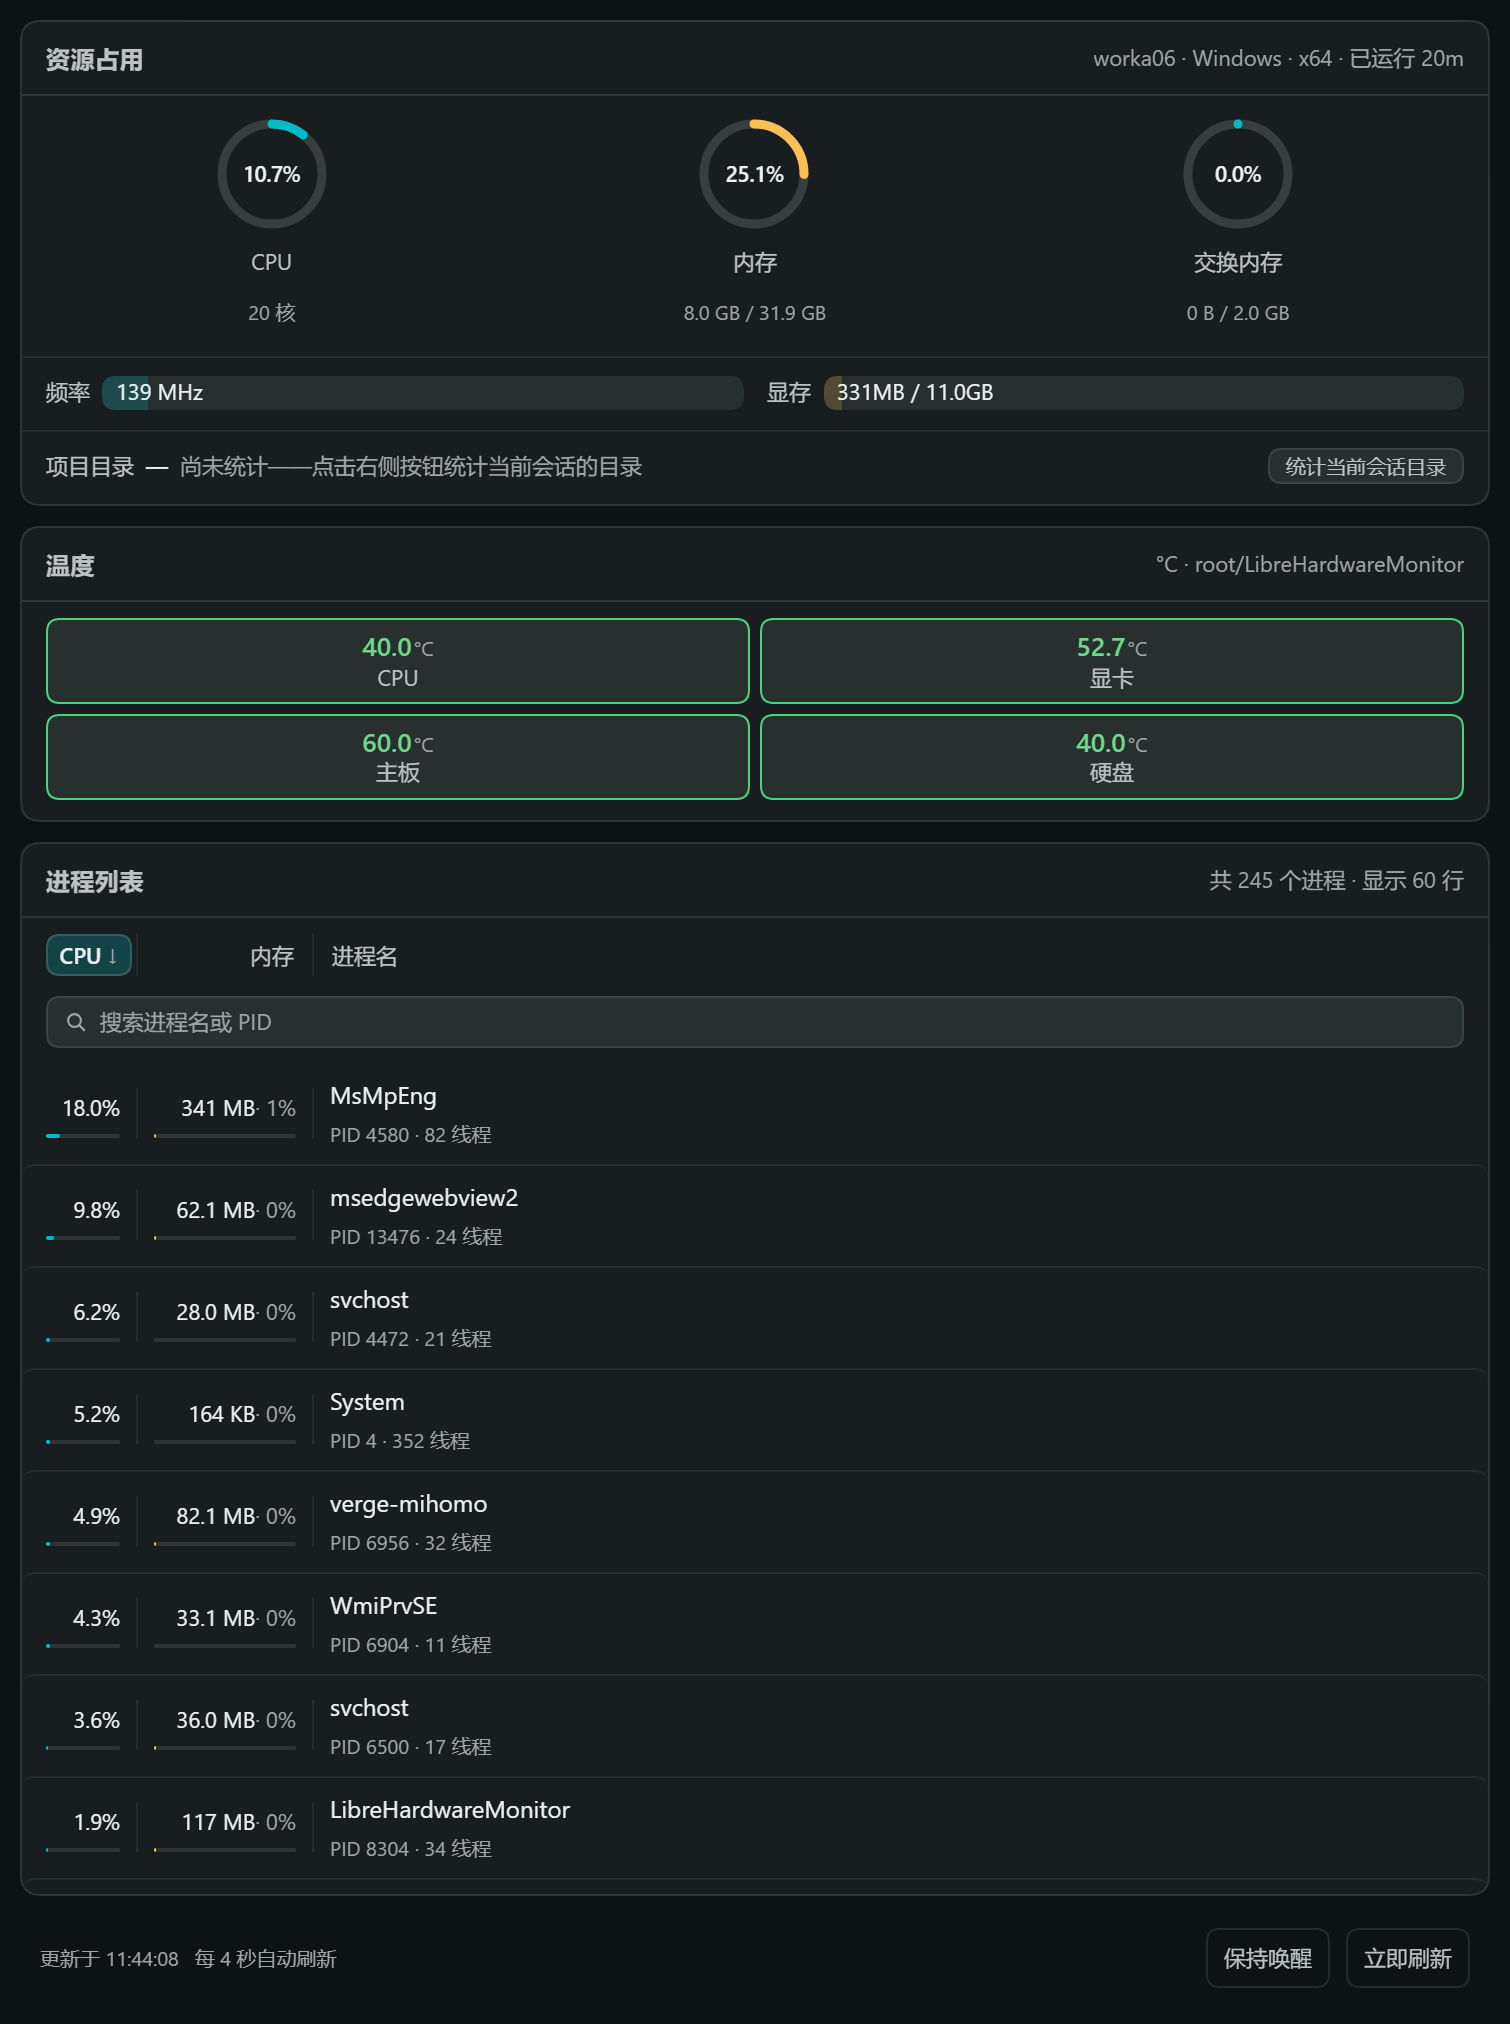
One page in the right Sidebar, one button in the Session header:
- Resource usage — ring gauges for CPU, memory and swap, each with a supporting line (cores and load, used of total, swap state); a GPU bar splitting the core clock and dedicated VRAM into two halves with progress fills; the viewed session's project-folder size on demand; the host's name and uptime in the card header.
- Temperatures — CPU, GPU, motherboard and drive tiles on a cool / warm / hot scale (70 °C and 85 °C). A tile shows its hottest sensor, so a multi-core package or a pair of drives stays readable, and its tooltip names every sensor it covers. See Temperatures for what each platform can answer.
- Windows CPU temperature installs itself — the card's title bar carries a pill for LibreHardwareMonitor: monitor missing → Install LHM (winget's pinned package), installed but silent → Start LHM (one elevated launch), running → the button retires itself and the readings flow. The tooltip states up front that the UAC prompt answers on the host's desktop, and a host without winget gets the official download link instead of a dead end.
- Processes — one row per process: CPU share, resident memory, its share of RAM, PID and thread count. Sort by CPU, memory or name, filter by name or PID, drag a column divider to resize (widths are remembered per browser). The metric columns never shrink, so a narrow Sidebar loses names before it loses numbers.
- Refresh — one interval drives every window (2 s Linux / 3 s macOS / 4 s Windows by default), and polling pauses while the browser tab is hidden. The temperature card is the exception: it moves on its own calmer cadence, because a temperature is an absolute reading and is expensive to read on Windows.
- Keep awake — a footer toggle so a remote session is not cut off by the
host's idle sleep. The click runs on the host, which holds the OS wake lock
(Windows
SetThreadExecutionState, macOScaffeinate, Linuxsystemd-inhibit --what=sleep:idle— never shutdown) until clicked again or the GUI exits. While off it costs nothing at all; while on it costs one sleeping helper process, and its "log" is a 10-event ring in memory — no file, ever. A host without the platform tool shows the button disabled with the reason.
A figure no platform can answer shows — with the reason in its tooltip —
never a 0, because zero reads as a measurement.
Requirements
- Linux, macOS or Windows — which figures each one can answer is in Platform support.
- DeepSeek Harness
0.2.0-rc.1or a compatible release, on a profile that boots@deepseek-ai/dsh-web-app(thewebprofile does).
No runtime dependencies: the host half uses node:os and each platform's own
tools, and the browser half uses the React the GUI already provides.
Install
# From npm
dsh plugin --profile web add @xmwengxing/dsh-client-ui-sidebar-perfmon

# From a local checkout
dsh plugin --profile web add /path/to/dsh-client-ui-sidebar-perfmon

# From git (pnpm must be allowed to run the build first)
dsh plugin --profile web add github:xmwengxing/dsh-client-ui-sidebar-perfmon
Then restart the GUI. Remove it again with
dsh plugin --profile web remove @xmwengxing/dsh-client-ui-sidebar-perfmon.
To open the panel: the right Sidebar's guide page lists a 性能监控 card that opens the page as a tab; from then on the 性能监控信息 button in the Session header opens or focuses that tab.
Configuration
The defaults are deliberately calm — one /proc walk every two seconds, shared
between every open panel. Override them in a profile patch when needed:
# ~/.dsh/profiles/web/cordis.patch.yml
- id: perfmon
  name: '@xmwengxing/dsh-client-ui-sidebar-perfmon'
  config:
    refreshIntervalMs: 1000        # 500–60000; default 2000 Linux / 3000 macOS / 4000 Windows
    processLimit: 100              # 5–500; rows served per response
    cacheMillis: 800               # 0–10000; polls inside this window share one reading
    sampleMillis: 150              # 0–2000; length of the first reading's priming sample
    projectDirEntryBudget: 50000   # 100–1000000; entries one folder's scan may examine
    projectDirMaxDirs: 12          # 1–100; distinct folders one scan may cover
    temperatureIntervalMs: 15000   # 2000–600000; how long one temperature reading is reused
    gpuIntervalMs: 4000            # 500–60000; defaults to refreshIntervalMs
    # gpu: false                   # hide the GPU line entirely
    # temperature: false           # hide the temperature card entirely
    # keepAwake: false             # hide the keep-awake (anti-sleep) footer button
    # projectDir: /srv/demo        # pin one folder instead of the viewed session's workspace
    # projectDir: ''               # or hide the directory-size line entirely
Platform support
One reader per platform family, each reading the platform's own source.
| Linux | macOS | Windows | |
|---|---|---|---|
| CPU %, per-core | /proc/stat | os.cpus() | os.cpus() |
| Load average | yes | yes | no — Windows has no such concept, so the line is omitted |
| Memory total / used / available | /proc/meminfo (MemAvailable) | vm_stat (free + reclaimable pages) | Win32_OperatingSystem + AvailableBytes |
| Cache / buffers line | Cached, Buffers | file-backed pages as cache; no buffer figure | CacheBytes; no buffer figure |
| Swap | /proc/meminfo | sysctl vm.swapusage | page file (SizeStoredInPagingFiles) |
| Process list | /proc/<pid>/stat, in-process | ps -Ao pid=,state=,time=,rss=,comm= | one PowerShell call |
| Process state | yes | yes | no — shown as — |
| Thread count | yes | no — BSD ps has no portable keyword | yes |
| Temperatures | /sys/class/hwmon, else /sys/class/thermal | powermetrics (root), osx-cpu-temp, istats | LibreHardwareMonitor / OpenHardwareMonitor, ACPI zone, storage counters, nvidia-smi |
| Project-directory size | in-process walk, all three platforms alike | same | same |
Anything a platform cannot answer is reported as null and rendered as —,
with the reason in the panel: a temperature tile's reason is in that tile's
tooltip, and the reading's other warnings hang on the footer timestamp. Nothing
is filled in with a zero.
Cost. Linux reads /proc in-process and spawns nothing. macOS and Windows
spawn one helper per sample, so their default refresh is calmer — 3 s and 4 s
against Linux's 2 s — and refreshIntervalMs overrides it. A platform without a
dedicated reader (FreeBSD, Solaris, …) falls back to a node:os-only reader:
real CPU and memory totals, with swap and the process table marked unavailable
rather than guessed.
How the numbers are produced
Every percentage is a difference between two samples of a cumulative counter, so the plugin never assumes a tick rate. Two conventions are worth knowing:
- Process CPU is scaled so 100% means one core — the
topconvention, so an eight-thread process on four cores can read above 100%. - Memory "used" means "not available": page cache is reclaimable, so it counts as available, not as used.
The first reading of a session is primed with a short second sample, so the
panel opens on a real percentage rather than a zero. Two states are reported
honestly instead: a process first seen in the current window shows — until
it has a second sample to difference against, and a host without swap shows
"未启用" rather than an empty 0% ring.
The project-directory line
Measuring a folder is CPU- and IO-heavy work, so the line under the gauges is manual by design: its button scans the workspace folder of the session you are viewing, can be stopped mid-walk (keeping the partial figures with an explicit "stopped" note), and is bounded — 50,000 entries per folder, 12 folders per scan, symlinks neither followed nor counted, with every shortcut named beside the figure. Between scans the polling reads only the stored result, so an open panel costs nothing.
GPU clock and VRAM
| Figure | Linux | macOS | Windows |
|---|---|---|---|
| VRAM used / total | amdgpu sysfs (mem_info_vram_*); nvidia-smi | nvidia-smi only | the OS's own GPUPerformanceCounters memory counter (any vendor, nothing installed), plus the 64-bit adapter total from the registry; nvidia-smi when present |
| Core clock | gt_cur_freq_mhz (i915) or amdgpu pp_dpm_sclk; nvidia-smi | nvidia-smi only | nvidia-smi (NVIDIA) or a running LibreHardwareMonitor / OpenHardwareMonitor (other vendors) |
- VRAM needs no third-party software. On Windows the operating system reports
dedicated usage for NVIDIA, AMD and Intel alike, and the adapter's true 64-bit
total comes from the display class registry key — deliberately not
Win32_VideoController.AdapterRAM, a 32-bit field that wraps at 4 GiB. - The clock has no OS-level source on Windows, so on a machine with neither
nvidia-sminor a hardware monitor the clock shows—while VRAM still reads, instead of a percentage invented from a guessed maximum clock.
The two figures share one row — clock left, VRAM right, each a track with its own
fill (the clock's against its own boost ceiling, VRAM's as used-of-capacity) —
wrapping to two full-width rows rather than clipping when the Sidebar is too
narrow for both. The bar refreshes with the panel (gpuIntervalMs, defaulting to
refreshIntervalMs), because VRAM is the figure that matters while a model
loads. gpu: false hides it.
Temperatures
A temperature is an absolute value, not a counter, so it gets its own calmer
cadence: one reading is reused for temperatureIntervalMs (15 seconds by
default) because a Windows read costs a second-plus PowerShell call.
| Component | Linux | macOS | Windows |
|---|---|---|---|
| CPU | coretemp / k10temp / zenpower / cpu_thermal and friends; x86_pkg_temp zone | powermetrics CPU die; osx-cpu-temp; istats | LibreHardwareMonitor / OpenHardwareMonitor /intelcpu/, /amdcpu/ |
| GPU | amdgpu / radeon / nouveau / i915 / xe chips | powermetrics GPU die; istats | the monitor's /nvidiagpu/, /atigpu/; else nvidia-smi |
| Motherboard | acpitz, it87, nct6775, dell_smm, thinkpad and friends | — | ACPI zones; the monitor's /lpc/ |
| Drives | nvme, drivetemp chips | — | Get-StorageReliabilityCounter per physical drive |
- The ACPI thermal zone is the motherboard, never the CPU — by ACPI's own definition it is a board sensor, and on many desktop boards it is a near-constant placeholder (this machine reported 27.9 °C under an all-core load).
- Windows CPU temperature needs a hardware monitor: run LibreHardwareMonitor
0.9.4 (the portable zip, as administrator — 0.9.6 dropped the WMI provider
this plugin reads) or OpenHardwareMonitor; without one the CPU tile is
—with the reason. Intel'sDistance to TjMaxis headroom, not a temperature, and is excluded. - macOS needs a root or user-installed source:
powermetricsas root, orosx-cpu-temp/istatsinstalled. With none of them every tile is—.
Privacy
The plugin reads local kernel counters and returns them only to the browser that asked. It makes no network requests of its own, sends nothing anywhere, and writes no files. The route is protected by the same auth as the rest of the GUI.
Limitations
- No process owner, command line or process tree. Each row carries name, PID, state, thread count, CPU and resident memory.
- Temperatures depend on what the platform exposes (see
Temperatures); a machine with no source shows
—and the reason rather than a borrowed number. - No fan speeds, voltages or per-core detail in the tiles: the headline is a component's hottest sensor, and every sensor it covers is in the tooltip.
- No history — current readings only, no sparklines or retained samples.
- Polling, not streaming — refreshes are interval requests, not pushed.
- The header button opens the panel, it does not toggle it; closing it is the Sidebar's own control.
License
MIT
Related plugins
dsh-web (dsh-task-board)
zhu1090093659/dsh-web
dsh-web (dsh-web-all)
zhu1090093659/dsh-web
dsh-web-ui (dsh-task-board)
zhu1090093659/dsh-web-ui
dsh-web-ui (dsh-web-ui-all)
zhu1090093659/dsh-web-ui