dsh-dock-insight
zkw90274-dot/dsh-dock-insight
Folds the composer dock's context occupancy, session timing and token usage into one pill that opens a panel, adds the signed-in account's wallet balance, and hides the host's own dock readouts while loaded.
Install
dsh plugin --profile web add github:zkw90274-dot/dsh-dock-insightREADME
Dock Vitals (dsh-dock-insight)
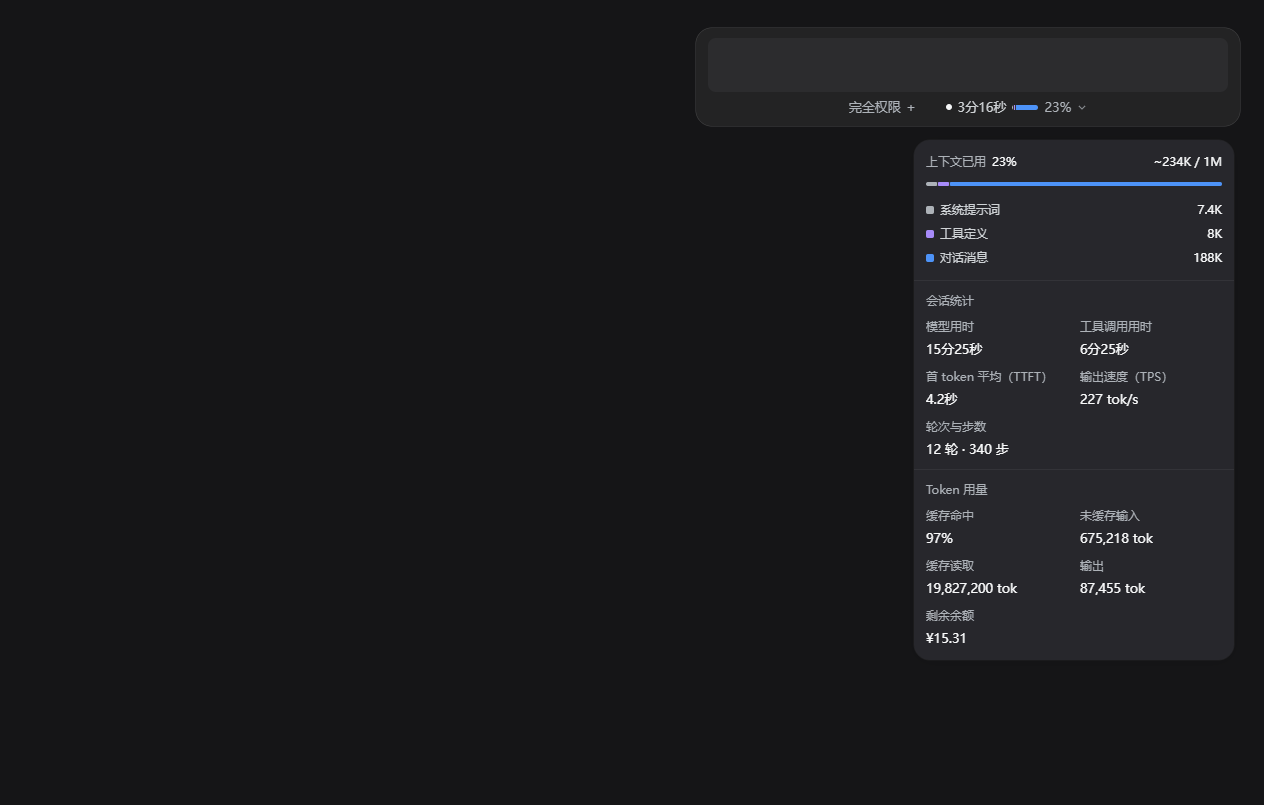
A compact readout in the composer dock, plus a click-open panel that explains the numbers: context occupancy with its composition, session timing, and token usage.
Screenshots
What it shows
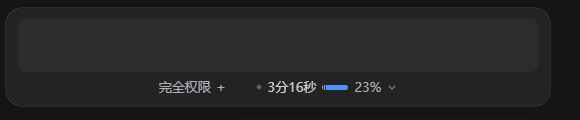
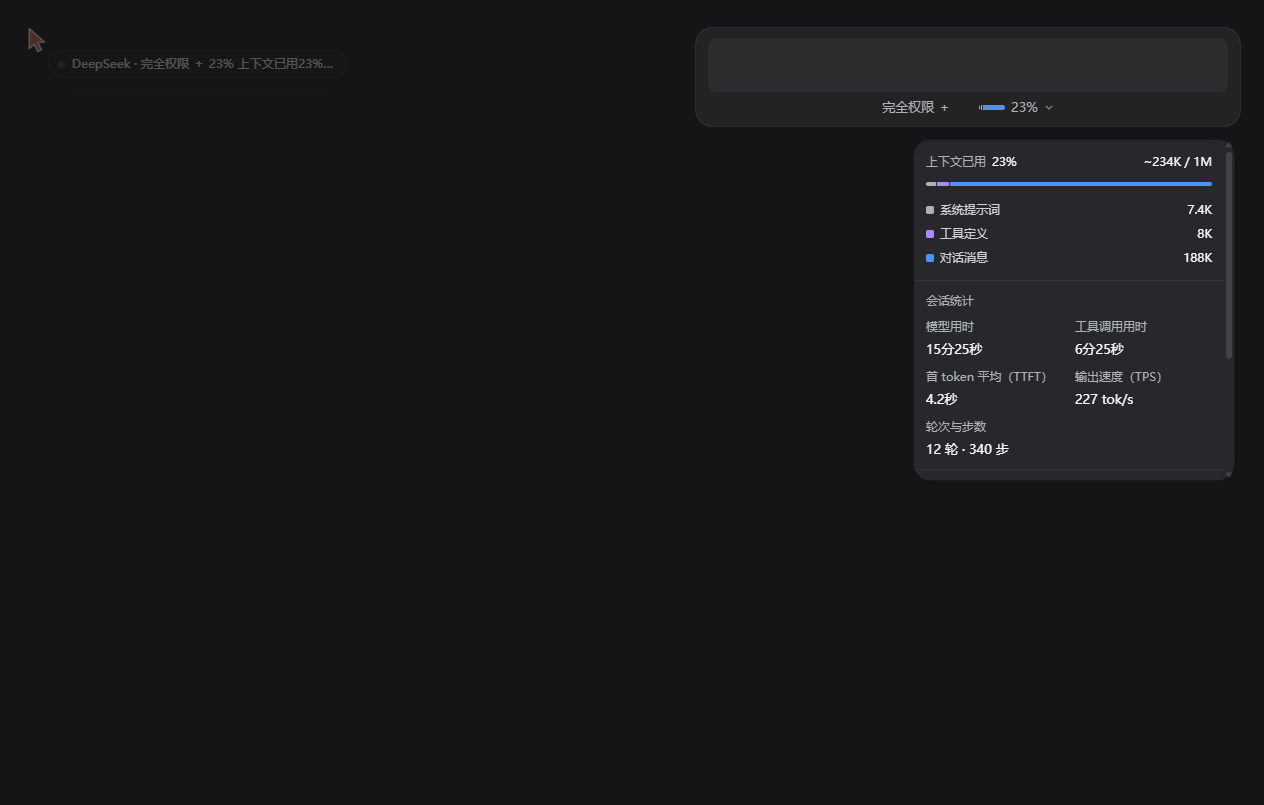
Dock readout — a 26px composition swatch (system prompt / tool definitions / conversation, in the same tints the host uses), the occupancy percentage, and a caret that opens the panel.
Panel
| Section | Figures |
|---|---|
| Context | occupancy percentage, ~used / window, stacked composition bar, per-part token counts |
| Session stats | model time, tool time, average first token (TTFT), output speed (TPS), turns and steps |
| Token usage | cache hit, uncached input, cache read, cache write (when the provider reports one), output, balance left |
Where it lives
Two slot entries share one module-level store:
conversation.composer.dock(order: 2) — the dock readout. It owns the figures, read from thecontextPressure,contextBreakdown,tokenUsageandsessionStatsprojections.shell.overlay(order: 1200) — the panel. It is rendered in the frame's floating layer because the docked composer clips its own overflow, and it is positioned against the readout's live rect (above it, flipped below when there is no room, clamped to the viewport).
Closing: click outside, press Escape, or click the readout again.
The panel caps itself at min(70vh, 560px) and scrolls with the wheel once the
readings outgrow that box, so adding a section never makes it sprawl over the
conversation. Its own scrollbar is themed (--dsw-alias-border-l2 thumb,
transparent track), overscroll-behavior: contain stops the scroll from
chaining into the chat behind it, and a wheel listener stops propagation at the
panel edge.
Running indicator
While this Session is producing a reply, the pill grows a pulsing dot and a
wall-clock counter (● 3分16秒). The counter starts when this dock first sees
the Session running, keeps counting across re-mounts, and clears the moment the
Session goes idle again.
It is a clock, not a speed. The only rate the Client exposes is
sessionStats.decodeTokens / decodeMs — an average over every turn of the
Session — so printing it on the pill would read as live throughput when it is
not. The panel keeps that average where it is labelled as output speed.
The dot respects prefers-reduced-motion (it stops pulsing and holds a steady
dot) and the pill's accessible name gains · 回复中 while it runs. If a host
point ever omits the useSessionStatus hook, the indicator simply never shows.
It replaces the other dock readings
The shipped dock carries two pills of its own — activity (turns and steps,
with a session-stats dialog) and usage (token total, with a token-usage
dialog) — and both dialogs show exactly the figures this panel already shows.
Those two readings are folded into the panel instead of sitting beside it, and
one CSS rule hides them while this plugin is loaded:
[data-composer-dock]:has(.dsdi-root) > :not(:has(.dsdi-root)) { display: none }
It only fires when this plugin's root is actually in the dock (so disabling the
plugin brings the pills straight back), and it keeps the slot's own anchor for
this entry — that anchor is what carries .dsdi-root — while hiding every
sibling anchor and the host context meter next to it.
The rule is the paint-time half. The mount effect does the same walk in script
(hideSiblings), because the slot renderer is free to nest entries inside a
wrapper: from our own anchor it climbs to [data-composer-dock] and hides, at
every level, the children that contain no .dsdi-root, restoring each one's
inline display on unmount. That covers the shape :has() cannot reach, and
the CSS still wins the first paint before the effect runs.
Slots have no removal API, so suppressing a sibling registration can only be done from the DOM — which is why this is DOM work rather than a slot call.
Conventions it follows
- Only
--dsw-alias-*/--dsw-*theme tokens for containers and controls, so it follows light and dark themes. - No Harness Client package is imported at runtime; the markup and CSS borrow
the host context meter's visual language (13px tabular trigger, 12px panel,
4px stacked bar,
elevation-prominentsurface). - Visible copy comes from the Client locale service (
en,zh). - Read-only: the panel never writes session state.
Balance cell
The last cell of the Token usage grid is the account's spendable balance:
recharge and bonus wallets of the signed-in account, summed per currency (CNY
preferred, $ when the account reports USD), formatted exactly like the stock
account settings page (¥0.00, <¥0.01, ¥1,234.56, two decimals truncated).
It is read through remote.account.getBalance — the same Remote call the
account settings page makes — with the client metadata built from
__DSH_BOOT__.release.version. The dock re-reads every 60s while mounted and
again when the panel opens; there is no push channel, so the figure can lag by
up to a minute. Signed out, no account service, no permission, or a failed call
leaves the cell as — rather than a zero.
Deliberate omissions
- No session cost. The wallet balance exists, so a cost could only be the balance drop over a window — and that drop cannot be attributed to one session (another session, subagent or export billing the same account lands in it too), while a per-token figure would need a rate table the Host does not publish. Reporting either as "this session cost" would be a number that looks precise and is not, so the cell was dropped instead.
Figures that are estimates
- Context occupancy prefers
projectedTokensoverpressureTokens, so the header is prefixed with~exactly like the host context panel. - The composition split is the Host's heuristic
contextBreakdown; its three parts do not sum to the occupancy numerator. - The bar is a composition bar: its three parts are normalized to fill it, so a full bar means "these three shares", not "the window is full". The percentage is the only occupancy gauge — that is what keeps the 26px dock glyph readable when occupancy is still low.
Related plugins
DeepSeek-Balance-Whale-Widget
meteornox/deepseek-balance-whale-widget
dsh-context
bowenliang123/dsh-context
dsh-cost-meter
han-1413141/dsh-cost-meter
dsh-damage-pulse
wssfk12138/dsh-damage-pulse