dsh-profile-stats
lovenndme/dsh-profile-stats
A personal usage profile page in the DSH sidebar. Cumulative tokens drawn as an input / output / cache-hit donut, today's tokens, longest task time, active-day streaks, a 12-month activity heatmap with daily / weekly / cumulative scopes, a time-based bar chart that splits tokens by model (Flash / Pro), and a per-provider billing breakdown for today or all time. Everything is folded from this machine's own session logs through ctx.sessionQuery. The only outbound request is a six-hourly read of this package's own version from the npm registry, used by the in-panel update button — no telemetry, no credentials, nothing uploaded.
Instalar
dsh plugin --profile web add github:lovenndme/dsh-profile-statsREADME
dsh-profile-stats
A personal usage profile page in the DSH sidebar: cumulative tokens, today's usage, an activity heatmap, a split by model, and a split by billing route — all folded from this machine's own session logs.
English · 简体中文
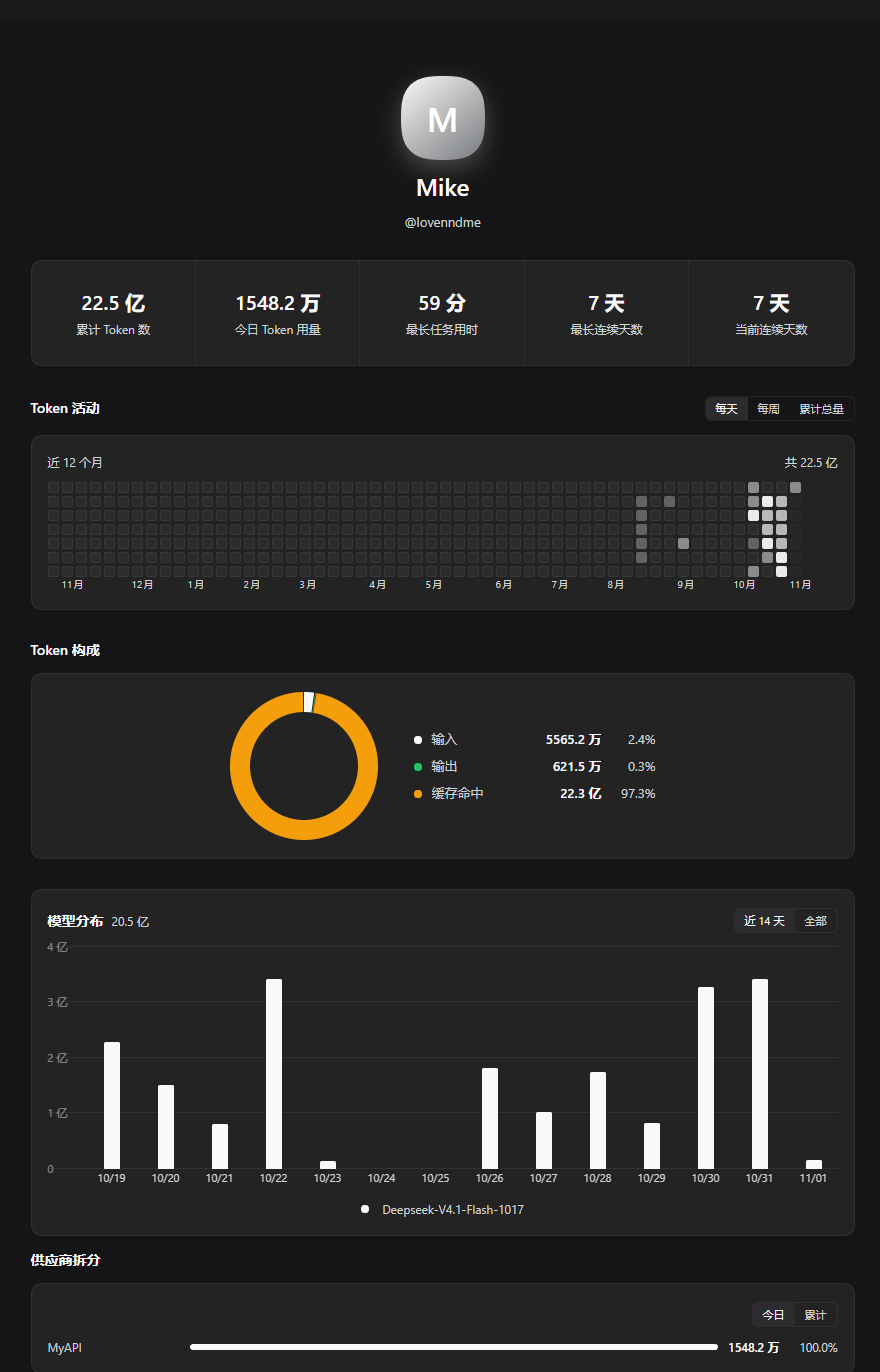
What you get
- Cumulative tokens, drawn as an input / output / cache-hit donut
- Today's tokens, longest task time, and active-day streaks
- A 12-month activity heatmap (daily, weekly, running total)
- Tokens by model over time (Flash / Pro)
- Tokens by provider (today or all time), for reconciling gateway billing
Install
From the marketplace: Plugins → Discover, search dsh-profile-stats.
Or directly:
plugin_manager(action: "install_bundle", target: "dsh-profile-stats")
Requirements: dsh >= 0.2.1-rc.5 < 0.3.0. No other plugin, no dependencies.
License
MIT © 2026 Lovenndme
Metric definitions, the data flow, what leaves the machine, update mechanics and troubleshooting live in docs/INTERNALS.md.
Plugins relacionados
DeepSeek-Balance-Whale-Widget
meteornox/deepseek-balance-whale-widget
dsh-context
bowenliang123/dsh-context
dsh-cost-meter
han-1413141/dsh-cost-meter
dsh-damage-pulse
wssfk12138/dsh-damage-pulse