dsh-incident-studio
eclipse-notfound/dsh-incident-studio
Screen frames, log lines and (on Windows) key/mouse input on one millisecond timeline: record, mark the failing seconds, box the problem on the frame, then hand the agent a keyframe strip, an animated GIF and the aligned log slice.
Установка
dsh plugin --profile web add github:eclipse-notfound/dsh-incident-studioREADME
Incident Studio · dsh-incident-studio
English | 中文
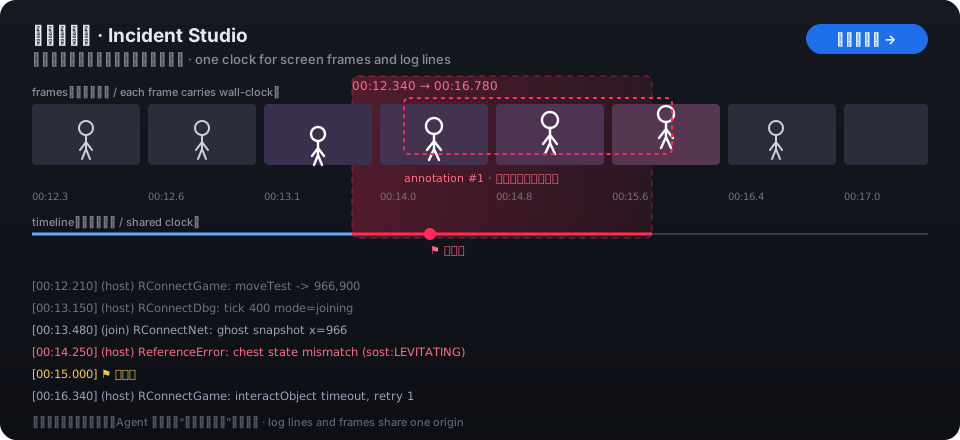
A right-sidebar plugin for DeepSeek Harness that puts screen frames, log lines and keyboard/mouse input on one millisecond timeline. Record, mark the seconds that went wrong, drag boxes on the frame, type one sentence — then hand the agent a keyframe strip, an animated GIF, the aligned log slice and your description, straight into the composer.
Nothing here is game- or project-specific: log sources are configured, any program that writes a file works, programs can push events directly, and the input recorder is told which process to watch.
The problem it solves
A hands-on bug report ("I picked up the chest and the character floats") is obvious on screen and obscure in the log. You write a sentence, the agent has to guess which of the last 900 log lines was "that moment" — and which key you happened to press.
This plugin ties four things to one clock:
| Evidence | Where it comes from | Precision |
|---|---|---|
| Picture | Host-side frame capture (three paths, below) | 6 fps by default, every frame carries wall-clock time |
| Events | Log file tailing, markers, HTTP ingest | line-write time, tens of ms; ingest can be exact |
| Keys/mouse | Polling helper, only while a target owns the foreground | ~30 Hz, ±1 sample |
| Your words | boxes drawn on the frame + one sentence | attached to the selected range |
Every delivered log line is prefixed with [00:12.340] relative to the recording start — the same origin as the frames and the key events — so the agent never has to guess the moment, or what you pressed.
Using it
Record ──> frames + log lines + keys/mouse, one clock
   │
Mark (⚑) when it breaks ──> Stop
   │
Review: drag the range, box the problem, one sentence, browse the input list
   │
Build artifacts ──> frames.png (6-frame strip) + clip.gif, saved in the workspace
   │
Fill composer ──> text + attachments in the input box (or Send now)
- Open the panel: the
+in the right sidebar (guide card "Incident Studio"), or the🎥 Capturebutton under the composer. On first mount it opens itself once and remembers that inlocalStorage. - Configure log sources (once): panel → Settings → absolute path (or workspace-relative). The file may appear later — start recording first, launch the game afterwards. On the same page set the target process (e.g.
Remains) so the input recorder knows which window to watch. - Record: pick a capture source →
● Start recording. Hit⚑ Markwhen it breaks (as often as you like) — a mark automatically remembers the last key you pressed before it. - Review: the default range is the last mark ±3 s; drag the ends yourself or use
All/Last 8s/±3s around mark. Moving the playhead moves the log list; clicking a line seeks the picture. The Input block expands into every key press / click in the range, and each one seeks too. - Annotate: drag a box on the frame; each box takes a note.
- Hand off:
Build artifacts→Fill composer. The strip is attached by default, the GIF is optional; press Enter yourself or useSend now.
The ingest endpoint (for programs)
Any local process (a mod, a test script, a dev server) can push events instead of writing a file:
curl -X POST http://127.0.0.1:<dsh-port>/dsh-incident-studio/api/ingest \
  -H "content-type: application/json" \
  -H "x-incident-token: <token shown in the panel's Settings>" \
  -d '{"text":"entered the raiders room","src":"RConnect","level":"info"}'
The token is per host process and visible in the panel; the same-origin panel needs no token. Pass wall (epoch ms) to place an event at an exact time; otherwise arrival time is used.
What you get on disk
Into the current session workspace, .dsh-incidents/<recording-id>/:
.dsh-incidents/20261104-193045-a1b2c3/
  frames-20261104193045.png   six-frame strip with timestamps and red boxes
  clip-20261104193045.gif     animated GIF of the range (460 px wide)
  input.jsonl                 raw key/mouse events, one JSON object per line
  bundle.md                   full note: description, boxes, every event line, input record
  bundle.json                 the same, machine-readable
An excerpt of bundle.md:
# Character floats after picking up a chest

- **Captured at**: 2026-11-04 19:30:45 (+08:00)
- **Range**: `00:12.340` → `00:16.780` (00:04.440)
- **Capture path**: GDI screen grab 6fps
- **Input**: 12 key downs, 3 clicks, 1 foreground switch (26 events in range)

## What went wrong
Picked up the chest, the character levitates and never returns to the walk animation

## Event stream (in range)
```log
[00:12.210] (host) RConnectGame: moveTest -> 966,900
[00:14.250] (host) ReferenceError: chest state mismatch (sost:LEVITATING)
[00:15.000] ⚑ problem
Input record
- Sampling: polling at ~50 Hz, state changes only, no text content at all
- Scope: while
remainsis in front; pointer recorded at click positions only - 26 events in range: 12 key downs / 12 ups, 3 mouse clicks, 1 foreground switch
- Most pressed: W×8 (2.40s total), Space×2, LShift×2
- Longest hold: W 0.91s (
00:12.900→00:13.810)
Input around each mark
00:15.000 problem (last input: Space ↓ 0.12s before)
[00:14.420] W ↓
[00:14.880] Space ↓
[00:15.020] Space ↑ (0.14s)
What lands in the composer is the **compact** version: phenomenon, range, artifact paths, box notes, the key/mouse counts, and at most 80 log lines (errors and markers kept first, marks carry their "last input"); the full record is one path away.

## Three capture paths

| What the host process can reach | Path | Notes |
|---|---|---|
| `electron.desktopCapturer` (Electron main process) | timed JPEG grabs | 6 fps / 960 px / q62 by default; can pick a **window** |
| Node only (Electron utility process, plain `dsh web` host) | **Windows GDI grabber** (`tools/grab-frames.ps1`) | whole virtual desktop (all monitors), one long-lived PowerShell writing JPEGs; the host deletes each temp file as it ingests it |
| A real browser on `dsh web` | `getDisplayMedia` + `MediaRecorder` | needs screen-sharing permission; frames are extracted locally afterwards |

All three produce "frames with wall-clock time", so annotation, export and hand-off are identical.

> **Measured, not assumed**: the DSH desktop host cannot reach `desktopCapturer` (`/state` reports `nativeReason: "desktopCapturer 不可用"`), so the desktop app actually takes the GDI path. GDI uses `System.Drawing` + `Graphics.CopyFromScreen`: at 320 px / 4 fps a frame is ~5 KB, 1.4 s yields 5 frames with strictly increasing timestamps and the temp folder is gone after stop (`node test/live-capture.mjs`). The cost is that you cannot pick a single window.

Frame buffering is capped (900 frames / 96 MB / 5 minutes by default); the oldest frames are dropped, so a long recording cannot bloat the host.

## Keyboard and mouse input

"I pressed W and it froze", "clicking this button does nothing" — the agent cannot feel your hands. While recording, the plugin also records keys and clicks **on the same clock** as the frames and the log:

- **What**: every key down/up (name + virtual-key code), left/right/middle/X1/X2 button down/up with screen coordinates, foreground window switches (target / other / this plugin), and an optional pointer path.
- **How**: `tools/record-input.ps1` is a long-lived helper that reads `GetAsyncKeyState` every 20 ms (~30 Hz) and writes **changes only**. No keyboard hooks, no layout translation, no `ToUnicode` — deliberately: a low-level hook is what keyloggers install (antivirus bait) and it would put system input latency behind your process.
- **Only while a target owns the foreground**: set the target process in Settings (`Remains` or `Remains.exe`, comma separated). Alt-tab out and the recorder pauses with an explicit "focus lost" line, so typing elsewhere never lands in the record. The plugin host process is always excluded.
- **Hold durations**: key-up lines carry `(0.14s)`. Keys still held when focus leaves are *not* given a made-up release time; a single `blur-release: W, Space` line is written and those holds are left out of the statistics.
- **Mark anchors**: pressing `⚑ Mark` looks back 2 s for the last key/button down and writes it into the mark — `(last input: Space ↓ 0.12s before)`.
- **Caps**: 20 000 events per recording (oldest dropped and counted), 24 MB of raw JSONL, and the helper stops itself after 30 minutes.
- **Requirements**: Windows with the built-in Windows PowerShell 5.1. The first run compiles a small assembly (0.1–1 s, then cached under `%LOCALAPPDATA%\dsh-incident-studio\`).

Whether it works here is decided by a **real probe at start-up**; the result lands in `$DSH_HOME/storages/dsh-incident-studio/input-capability.json`, and Settings shows either `Input helper ready (108 keys)` or the concrete reason. When it is unavailable, only this one feature is off.

> **Measured**: `node test/live-input.mjs --inject` really presses left Shift (Shift alone types nothing) and asserts the helper saw the down and the up — a 155 ms hold became two events, within half a sample of truth. At 30 Hz the helper uses ~2.2% of one core and ~67–120 bytes per event.

## Configuration

The panel's Settings edits `<DSH_HOME>/storages/dsh-incident-studio/profiles.json` (`DSH_HOME` defaults to `~/.dsh`; on Windows `%USERPROFILE%\.dsh`). You can edit it directly:

```json
{
  "version": 1,
  "activeId": "my-project",
  "profiles": [
    {
      "id": "my-project",
      "name": "My project",
      "note": "main instance and test instance",
      "sources": [
        { "id": "main", "label": "main", "color": "#6aa9ff", "kind": "file",
          "path": "C:/Users/you/AppData/Roaming/MyApp/logs/main.log", "enabled": true, "preRoll": true },
        { "id": "test", "label": "test", "color": "#7bd88f", "kind": "file",
          "path": "C:/Users/you/AppData/Roaming/MyApp-test/logs/main.log", "enabled": true, "preRoll": true }
      ],
      "input": { "enabled": true, "targets": "Remains.exe", "scope": "target", "pollMs": 20, "trailHz": 0 }
    }
  ]
}
pathdoes not expand%VAR%or$HOME; use an absolute path or one relative to the workspace.preRoll(on by default) takes the last 96 KB / 800 lines when recording starts and marks them "before the recording"; those lines have no per-line timestamp, so they get ordinal placeholders (-Nms) to keep their order.kindisfiletoday;ingestandmarkerevents are generated by the plugin itself.input: key/mouse settings, stored per profile (one per game).targetsare process names (.exeoptional, case-insensitive, up to 8);scope: "all"records any foreground window except the plugin itself;pollMsis the sample interval (10–200, 20≈30 Hz, 10≈60 Hz);trailHz > 0also records the pointer path (much bigger file, off by default).enabled: falseturns the feature off.
Optional host config, on the profile's patch row:
- id: incident-studio
  config:
    artifactsDirName: .dsh-incidents   # artifact folder, relative to the session workspace
    captureFps: 6                      # frame rate
    captureWidth: 960                  # frame width
    captureQuality: 62                 # JPEG quality
    inputProbe: true                   # real input-helper probe at start-up (off saves one PowerShell run)
A copy-paste example: Remains (Adobe AIR) mod logs
AIR games write mod logs under File.applicationStorageDirectory, i.e. %APPDATA%\<app-id>\Local Store\:
C:/Users/<you>/AppData/Roaming/pfe/Local Store/<ModName>.log     ← main instance
C:/Users/<you>/AppData/Roaming/pfe2/Local Store/<ModName>.log    ← second test instance
Put those two absolute paths in two log sources. These logs are append-only: only new lines are captured, preRoll brings the tail in as "before the recording", and since the lines carry no timestamps the alignment is "the moment this line hit the file".
Install
Requires DeepSeek Harness 0.2.1+ (it uses the 0.2.1 Connection service and sidebar tab API).
# straight from this repo — client.js is committed, there is no build step
dsh plugin --profile <profile> add https://github.com/Eclipse-NotFound/dsh-incident-studio

# once it is on npm
dsh plugin --profile <profile> add dsh-incident-studio
Desktop profiles are managed by the app: install from Settings → Plugins with the package spec, not by pointing the CLI at profiles/web (that will not show up in the desktop app). A new host half needs one app restart; the browser half is republished and re-applied on the page.
Disable it by removing dsh-incident-studio from dsh.profile.bundles, or with a profile patch:
- id: incident-studio
  disabled: true
Privacy and boundaries
- Frames are captured only after you press Start recording, and stop when you stop. The GDI path grabs the whole virtual desktop — move sensitive windows away first.
- Key/mouse recording runs only during a recording and, by default, only while a target process is in front. It records which key went down/up and where the mouse clicked — no text at all (no layout translation, no
ToUnicode) — and installs no keyboard hooks. The plugin host process is always excluded, so typing into the panel or the chat is never recorded. - Frames, GIFs, the raw key/mouse record and the note are written only into the session workspace's
.dsh-incidents/;profiles.jsonand the three receipts (client-boot.json,capture-capability.json,input-capability.json) live in$DSH_HOME/storages/dsh-incident-studio/. The recorder's temporary JSONL lives in the system temp folder and is deleted right after being archived into the incident folder. - No network calls, no telemetry. Data reaches a model only after you press Fill composer / Send — through DSH's normal message path, exactly like typing it yourself.
- Every
/dsh-incident-studio/api/*route goes through the host's same-origin check; other local processes can only push events with the per-processx-incident-token./openmay only open paths inside this session's.dsh-incidents/. - The self-check receipts record counts and stages only (
client-boot.json: how far the page got;capture-capability.json: how many screens/windows exist;input-capability.json: key-table size and timing). No window titles, no pixels, no keystrokes.
Develop
npm ci                        # dev deps: type references plus jsdom / react-dom / gifenc for tests
node tools/build-client.mjs   # concatenate src/client/*.js into client.js, with a syntax check
node test/run.mjs             # 457 assertions: host routes, input recording, manifest/release shape, client pure functions, seat registration, jsdom click-through, GIF/strip, capture polling
node test/live-capture.mjs    # real GDI capture (grabs ~1.4 s of screen at 320px, deletes it immediately; keep it out of CI)
node test/live-input.mjs      # real input helper (--inject presses left Shift to prove capture works; keep it out of CI)
node tools/check-live.mjs --fetch   # check a running DSH: routes, module graph, served bundle, capture/input capability, page receipts
client.js is a generated artifact — do not edit it by hand. src/vendor/gifenc.js is generated from node_modules/gifenc by tools/vendor-gifenc.mjs (MIT).
index.js                             host half: log tailing, frame capture, input recorder wiring, 18 routes, artifacts
src/client/00-head.js … 90-tail.js   browser half, concatenated into client.js in order
tools/grab-frames.ps1                Windows GDI screen grabber
tools/record-input.ps1               key/mouse polling helper (compiles and loads the assembly below)
tools/input-interop.cs               interop source (GetAsyncKeyState / foreground process / precise clock + key table)
tools/check-live.mjs                 live self-check (routes / module graph / served bundle / receipts)
test/host.test.mjs                   real HTTP server exercising every route
test/input.test.mjs                  input recording: config, line parsing, statistics, anchors, markdown, fake helper end to end
test/manifest.test.mjs              package manifest / release shape (no BOM, dsh.bundle, files whitelist)
test/pure.test.mjs                   loads the shipped client.js and tests the pure helpers
test/client-apply.test.mjs           runs apply() against a fake client context, then the hand-off chain
test/capture.test.mjs                capture polling, stop, failure reporting, API error mapping
test/dom.test.mjs                    clicks through the whole panel inside jsdom
test/live-capture.mjs                real-machine GDI capture
test/live-input.mjs                  real-machine input helper (probe / self test / real run / optional injection)
check-live.mjs answers "is it actually loaded": 403 means a route is registered and rejecting external callers by design (404 means it is not registered); the module graph must contain this plugin and the served client.js must be byte-identical to your build (plus one source-map trailer); client-boot.json must show apply → seat → panel.
Known limitations
- Publishing timing: the host half is assembled at boot (editing
index.jsneeds a DSH restart); the browser bundle follows live updates and re-runsapplywhen the host republishes. Measured: a real content change to the profile'scordis.patch.ymltriggers a host recompose, editing files inside the plugin folder does not. - Alignment precision: tailing sees a line once it is written, so expect tens of milliseconds; use
/ingestwithwallwhen it must be exact. - The desktop path is a frame sequence, not a video: 6 fps reads gradient/interpolation glitches fine, single-frame animation curves less so. Raising
captureFpsto 10–15 costs memory and JPEG work. - GDI grabs the whole desktop: no per-window capture, all monitors merged.
- GIF uses one 128-colour palette (fixed from the first frame): small files and a clean picture for screen content; large gradients may band slightly.
- Browser webm extraction relies on seeking:
MediaRecorderoutput has no index, so a trailing frame can be lost in extreme cases. - No voice: descriptions are typed and boxed.
- Input is recorded only while a target owns the foreground — that is a safety default, not a defect. Use
scope: "all"to widen it, at the cost of recording other windows' keys too. - No mouse wheel:
GetAsyncKeyStatecannot see wheel deltas; that would need a mouse hook or Raw Input, which this plugin deliberately avoids. Mark and describe wheel actions instead. - Input timing is ±1 sample: 20 ms (~30 Hz) by default,
pollMs: 10for ~60 Hz (slightly more CPU). - The helper needs to compile C#: antivirus/EDR may block runtime compilation and loading of the small assembly (hit exactly that on the development machine:
Add-Type's temp file was refused). That is why the plugin runs a real probe at start-up, writesinput-capability.json, and shows the reason in Settings; when blocked, only input recording is unavailable. - Artifacts live in the workspace: add
.dsh-incidents/to your.gitignore(that includesinput.jsonl).
License
MIT. The product instinct is inspired by AGIHunt/blurt (a macOS menu-bar "talk to your agent" tool); this is a general-purpose incident panel inside DSH, with a different implementation and setting.
Похожие плагины
deepseek-harness
deepseek-ai/deepseek-harness
dsh-market
dsh-market/dsh-market
dsh-web (dsh-plugin-manager)
zhu1090093659/dsh-web
dsh-web
zhu1090093659/dsh-web