dsh-systeminfo
tntfireage/dsh-systeminfo
Adds a live system dashboard with per-core CPU, memory, GPU, processes, disk usage and a STOP action for ending processes, plus per-process energy on macOS, exposed as a browser page, a GUI panel and a `systemInfo` service other plugins can inject. macOS is the main platform and Linux is best-effort. The dashboard page and its read-only JSON (process list with users, disks, logged-in users) are served with no login check; publicDashboard: false only refuses non-loopback peers. STOP accepts loopback requests only and sends SIGTERM, then SIGKILL after a grace period, to any process your account may signal except pid 1, the DSH host and its parent.
Установка
dsh plugin --profile web add github:tntfireage/dsh-systeminfoREADME
dsh-systeminfo

A DeepSeek Harness (DSH) plugin that turns the machine's vital signs into a live dashboard: overall / per-core CPU, memory, GPU, logged-in users, active processes, per-process energy and disk usage.
Three ways to read it:
| Surface | Entry point | Best for |
|---|---|---|
| Browser page | http://127.0.0.1:<web-port>/systeminfo/ | open it directly, keep it on a second screen |
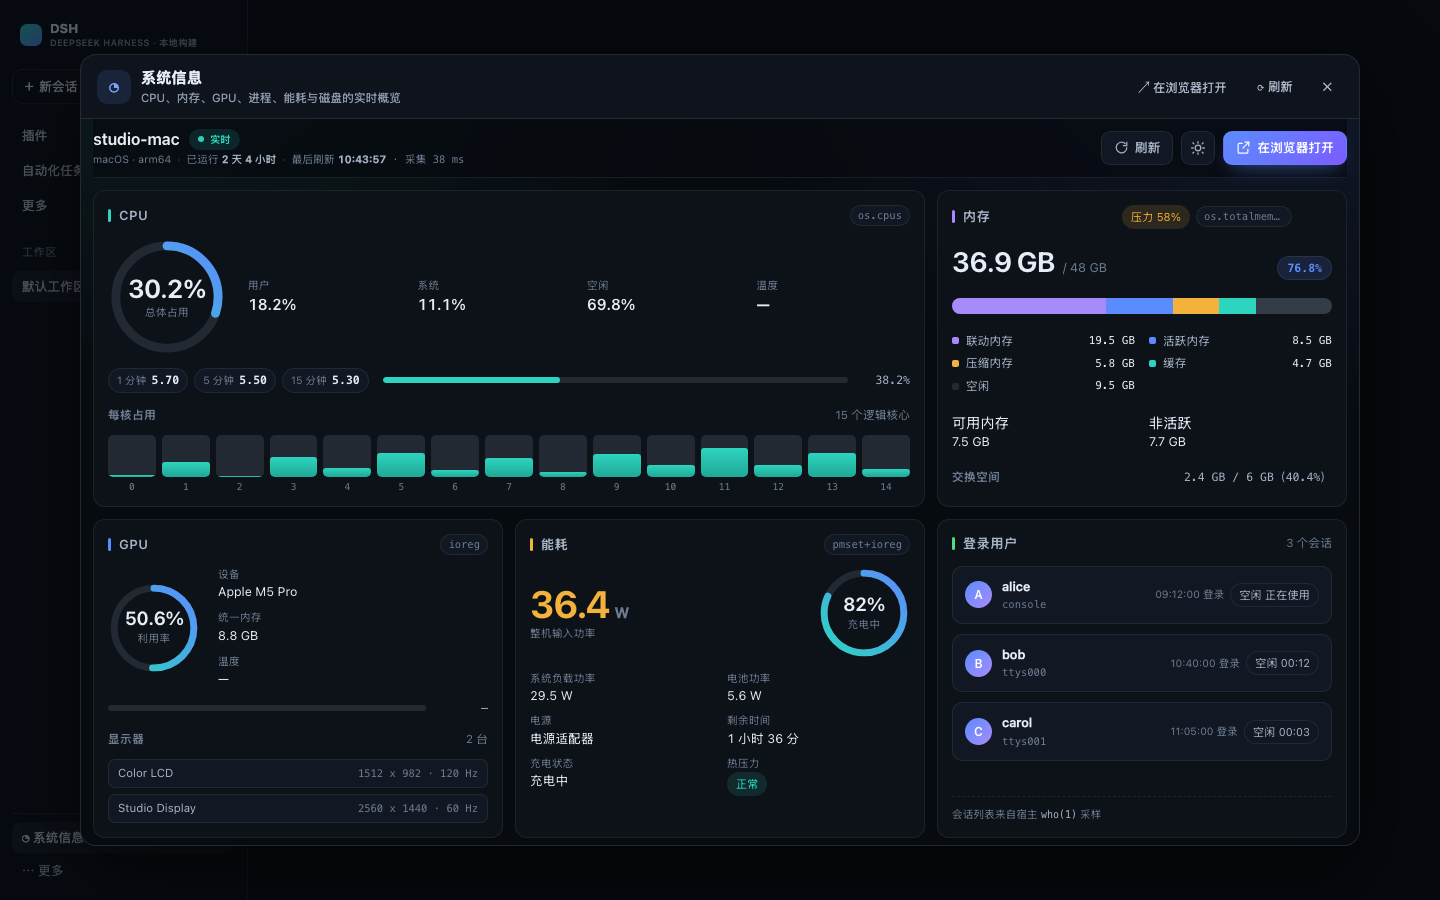
| DSH GUI | sidebar footer "系统信息" icon → overlay | watching metrics while using Harness |
| Host service | other plugins inject: ['systemInfo'] | programmatic metrics |
Zero third-party runtime dependencies: the host half uses only node:* built-ins, the
browser half only require('react'), and the dashboard is plain static HTML/CSS/JS that
works offline.
Features
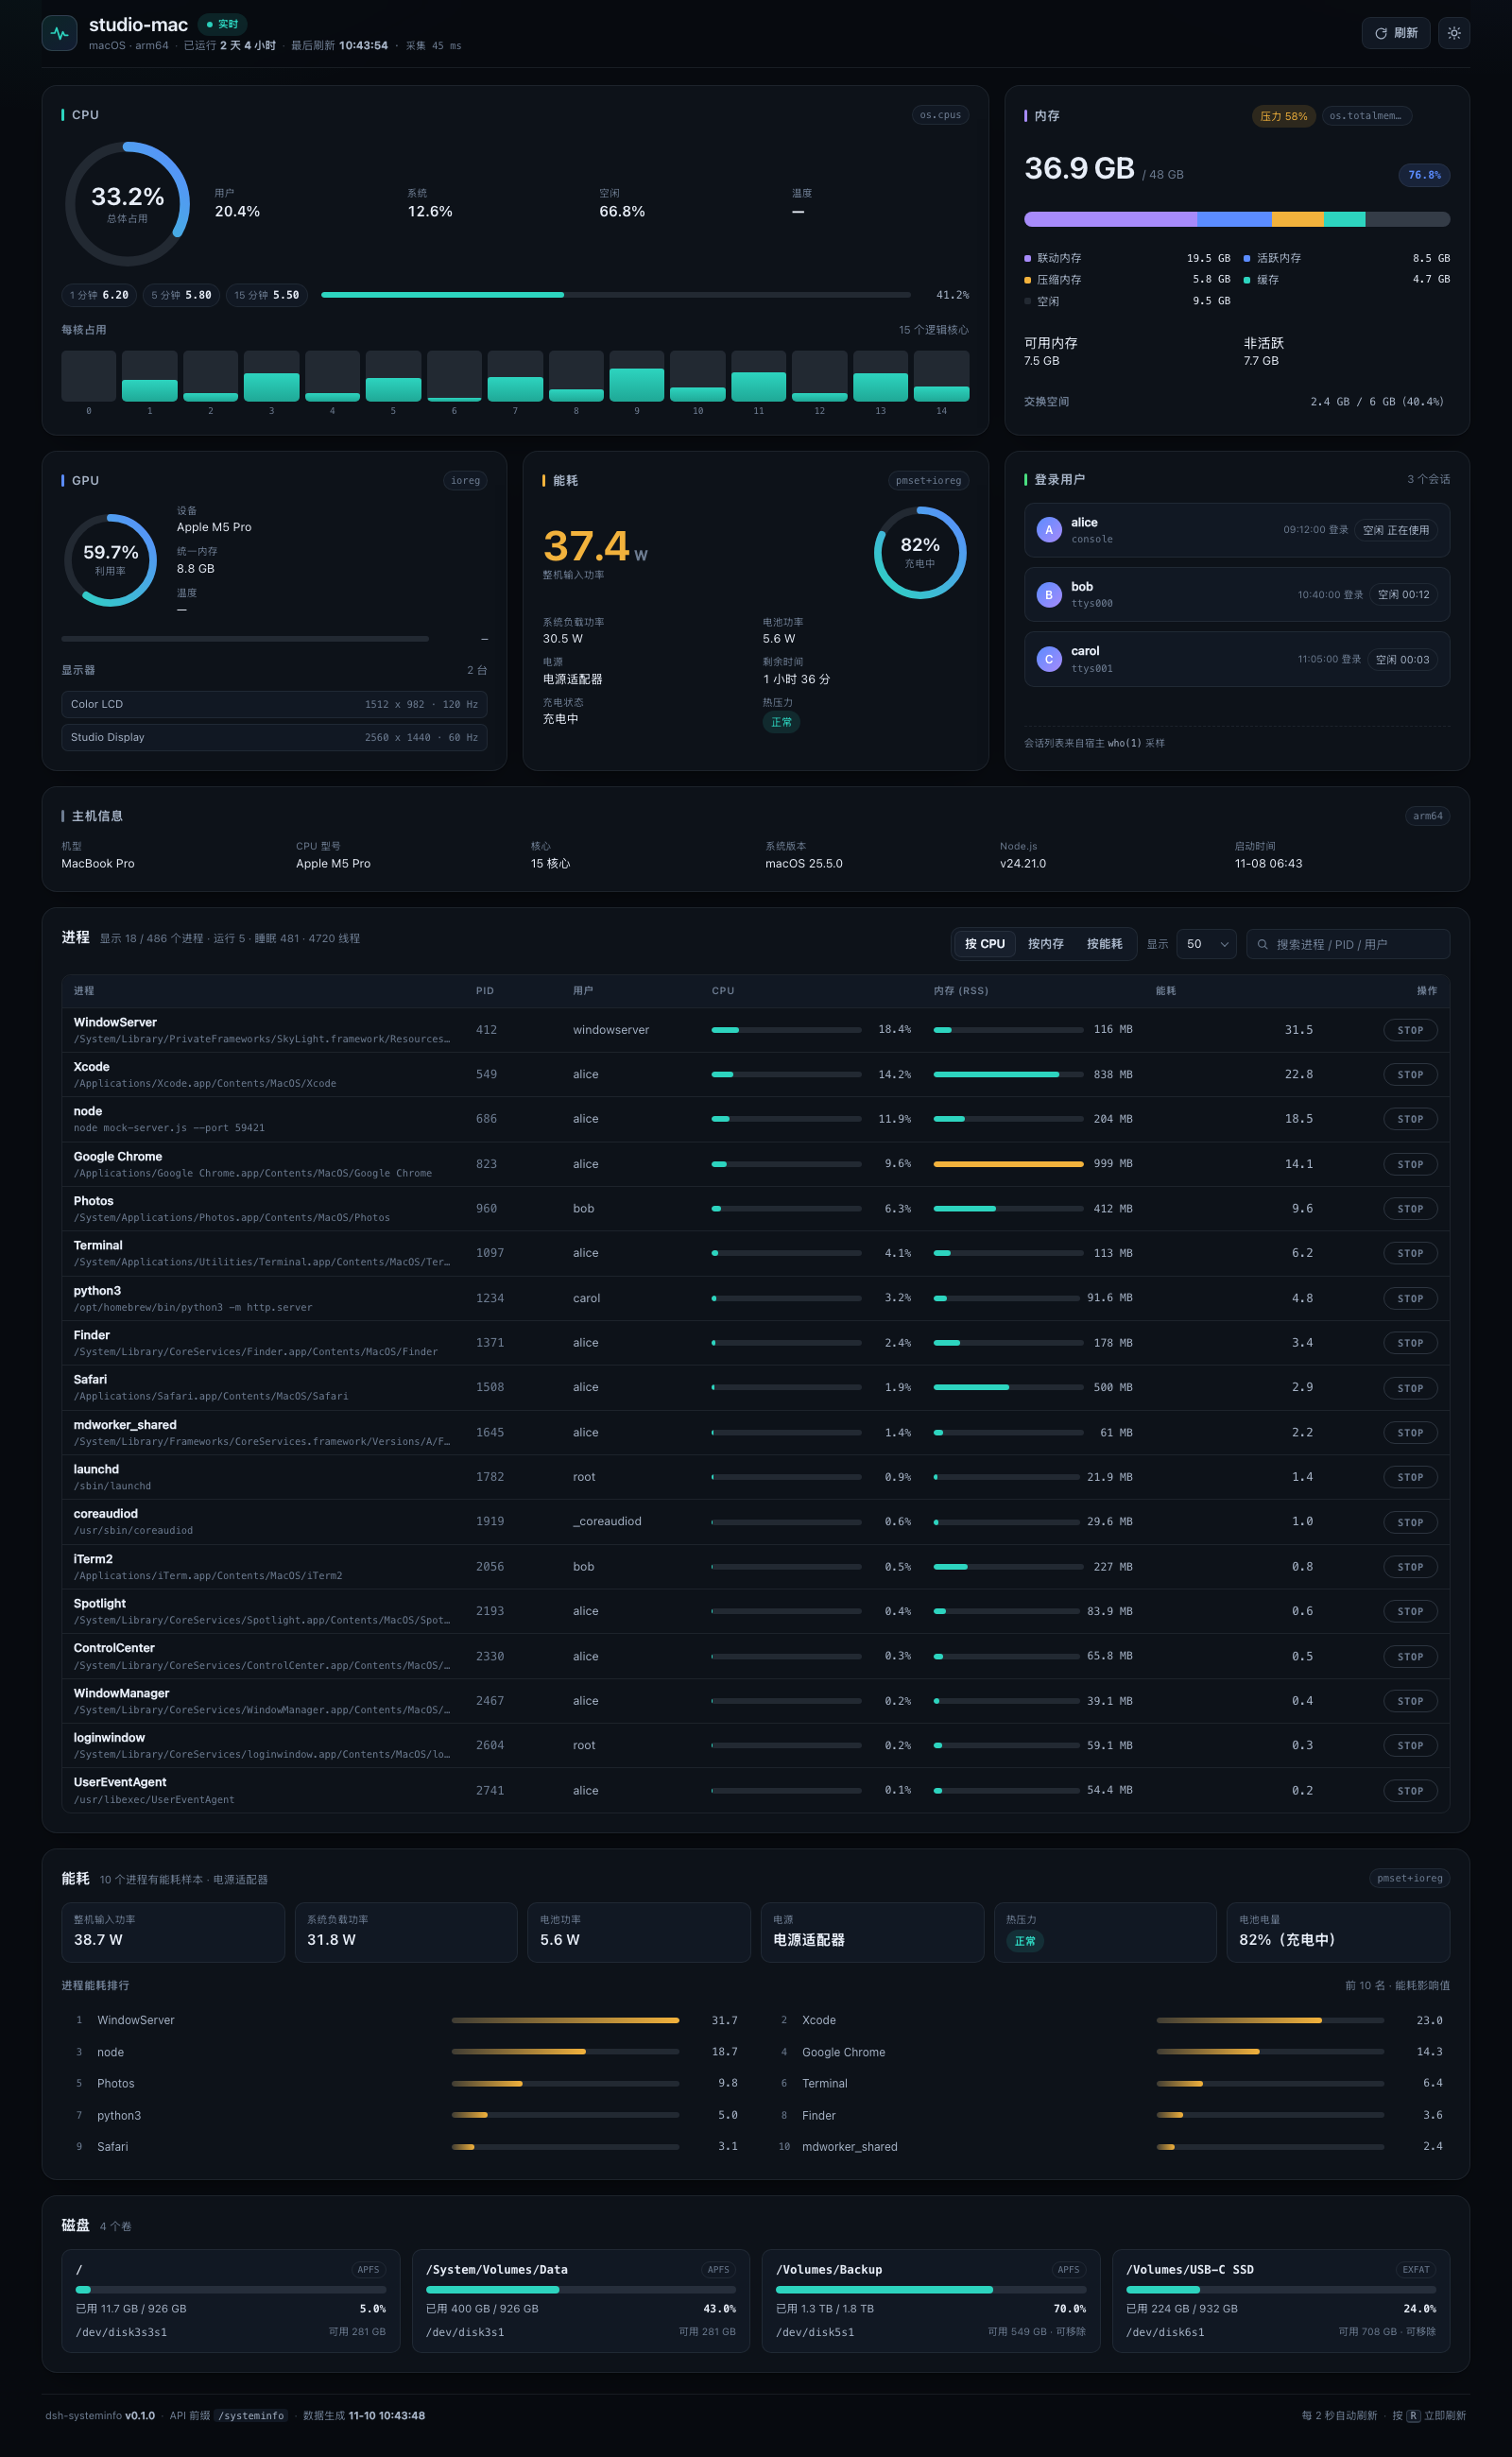
- CPU — overall utilization gauge, user/system/idle/nice, 1/5/15 load average, per-core heat bars;
- Memory — total/used, wired / active / compressed / cached / free stacked bar, swap, pressure;
- GPU — Apple GPU utilization, renderer/tiler utilization, unified memory, attached displays;
- Energy — wall/adapter input power, SoC load power, battery watts/percent/remaining, charging state;
- Users —
who -usessions (terminal, login time, idle); - Processes — default sort by CPU, switchable to memory or energy; search, limit, usage bars;
- Energy ranking — per-process energy impact (macOS
topPOWER column); - Disks — per-volume used/total/free with 85%/95% warning colors;
- Host facts — model, CPU model, cores, OS, Node version, boot time, uptime.
The page follows the system light/dark preference (and ?theme=dark|light), automatically
matches the DSH theme when embedded, refreshes every 2 s (energy 5 s, disks 10 s), and pauses
polling while the tab is hidden.
Screenshots
Browser dashboard (dark):
Embedded in the DSH GUI (sidebar footer "系统信息"):
Install
Requires DSH ≥ 0.2.0 and Node ≥ 20. macOS is the primary platform (Apple Silicon and Intel); Linux is a best-effort fallback; other platforms expose generic metrics only.
A. From GitHub (recommended)
dsh plugin --profile desktop add github:tntfireage/dsh-systeminfo
(replace desktop with your profile name; dsh web users usually use web.)
The built lib/ is committed, so the install is prebuilt — no build step is required.
You can also use Settings → Plugins → plugin list → Install plugin with
https://github.com/tntfireage/dsh-systeminfo.
B. From a local directory (development / offline)
- Settings → Plugins → plugin list → Install plugin;
- enter the local path
<path-to-dsh-systeminfo>(or itsfile:spec); - enable it and refresh the page — a "系统信息" icon appears at the sidebar foot.
Or from the CLI:
dsh plugin --profile desktop add <path-to-dsh-systeminfo>
C. Manual profile declaration
// <profile>/package.json
{
  "dependencies": { "dsh-systeminfo": "file:<path-to-dsh-systeminfo>" },
  "dsh": { "profile": { "bundles": ["@deepseek-ai/dsh-base", "@deepseek-ai/dsh-web-app", "dsh-systeminfo"] } }
}
cd <profile> && pnpm install
Usage
Open the Web GUI URL with the path replaced by /systeminfo/, e.g.
http://127.0.0.1:63405/systeminfo/, or use "在浏览器打开" in the GUI overlay.
Keyboard/mouse: R refreshes, the theme button toggles dark/light, the process panel supports
search / sort / limit.
Configuration
Override in the profile's cordis.patch.yml (all fields optional):
- id: dsh-systeminfo
  config:
    basePath: /systeminfo        # route prefix, no trailing slash
    sampleMs: 1000               # CPU / process sampling interval
    energySampleMs: 5000         # energy sampling interval
    maxProcesses: 200            # process API row cap
    publicDashboard: true        # public page/API (loopback-bound server only)
Service for other plugins
export const inject = ['systemInfo']

export function apply(ctx) {
  ctx.effect(() => {
    const timer = setInterval(async () => {
      const snapshot = await ctx.systemInfo.snapshot({ processLimit: 10, processSort: 'cpu' })
      console.log(snapshot.cpu.usagePercent, snapshot.memory.usedPercent)
    }, 5000)
    timer.unref?.()
    return () => clearInterval(timer)
  })
}
ctx.systemInfo.snapshot({ processLimit?, processSort? })  // Promise<SystemSnapshot>
ctx.systemInfo.processes({ sort?, limit? })              // Promise<ProcessRow[]>
ctx.systemInfo.energy({ limit? })                        // Promise<EnergySnapshot>
ctx.systemInfo.disks()                                   // Promise<DiskRow[]>
ctx.systemInfo.cpu() / memory() / gpu() / users()        // Promise<...>
Field definitions: docs/ARCHITECTURE.md §6. snapshot() never
rejects; failed fields are null and recorded in snapshot.errors[]. A runnable consumer
lives in examples/consumer-plugin/.
HTTP API
| Method | Path | Description |
|---|---|---|
| GET | /systeminfo/ | dashboard page |
| GET | /systeminfo/api/health | health check + plugin version |
| GET | /systeminfo/api/snapshot?processLimit=20&processSort=cpu | full snapshot |
| GET | /systeminfo/api/processes?sort=cpu|memory|power&limit=50 | process rows |
| GET | /systeminfo/api/energy?limit=20 | system power + process energy |
| GET | /systeminfo/api/disks | disk volumes |
| GET | /systeminfo/api/cpu /memory /gpu /users | single metrics |
| POST | /systeminfo/api/open | ask the host to open the dashboard in the default browser (loopback only; used by the GUI button) |
| POST | /systeminfo/api/kill | stop a process (the table's "操作 / STOP" action): body {"pid":123} + header x-dsh-systeminfo-action: kill; SIGTERM, SIGKILL after 2 s; PID 1 / the host and its ancestors are protected; loopback only |
curl -s http://127.0.0.1:63405/systeminfo/api/snapshot | jq '.cpu.usagePercent, .memory.usedPercent'
curl -s -X POST http://127.0.0.1:63405/systeminfo/api/open   # open the dashboard in your browser
curl -s -X POST -H 'content-type: application/json' -H 'x-dsh-systeminfo-action: kill' \
     -d '{"pid":12345}' http://127.0.0.1:63405/systeminfo/api/kill   # stop one process
JSON responses are application/json; charset=utf-8 with cache-control: no-store; only
GET/HEAD are accepted (405 + allow, except POST /api/open and POST /api/kill), unknown paths return 404, invalid query values 400.
Security
The Web routes are public but the Web server listens on loopback only, so metrics never leave
the machine. If DSH is bound to a non-loopback address, set publicDashboard: false (non-loopback
peers are refused) or add authentication in a reverse proxy. The plugin writes no files, makes
no outbound network requests, and never builds a shell command from request input.
The STOP action is a deliberately narrow mutating route: loopback peers and loopback Host
only, same-origin requests only (sec-fetch-site and Origin checked), JSON body plus a
non-simple x-dsh-systeminfo-action header (which forces a CORS preflight no cross-origin page
can satisfy), a validated integer PID passed to process.kill (never a shell), and a refusal to
stop PID 1, the DSH host itself, or any of its ancestors. The UI requires a second click within
4 s before sending.
Development
node scripts/build.mjs                            # copy src into lib/ + static checks
node --test test/                                 # unit, router, packaging and client-bundle tests
node scripts/verify.mjs http://127.0.0.1:63405    # live e2e contract check
node scripts/verify.mjs http://127.0.0.1:63405 --probe
Layout and responsibilities: docs/ARCHITECTURE.md.
Applying code changes: run node scripts/build.mjs, then disable and re-enable the
dsh-systeminfo bundle in Settings → Plugins (the host half reloads live without an app
restart), and refresh the GUI page so the client bundle updates. Only the first install (new
package resolution) needs an application restart. The committed lib/ keeps GitHub installs
prebuilt; after editing src/, rebuild and commit lib/ as well.
The "open in browser" button uses POST /systeminfo/api/open: the host process launches the
OS browser (open / xdg-open / start) because the DSH GUI runs inside Electron, where the
renderer's window.open is intercepted by the main process. A normal browser keeps using a
native new tab. The route accepts loopback peers and loopback Host headers only, always targets
the request's own origin, and is rate-limited to one launch per 1.2 s.
Known limitations
- CPU/GPU temperature and thermal pressure need root (
powermetrics) on macOS → shown as—; - per-process energy is macOS-only; on Linux the energy sort degrades to CPU;
- Apple Silicon unified memory has no "total VRAM", so the GPU card shows used/allocated only;
- Linux support is best-effort (procfs/sysfs, optional
nvidia-smi,df,who); missing fields arenull.
License
MIT
Похожие плагины
dsh-web (dsh-task-board)
zhu1090093659/dsh-web
dsh-web (dsh-web-all)
zhu1090093659/dsh-web
dsh-TUI
ccch1mneyyy/dsh-tui
dsh-web-ui (dsh-task-board)
zhu1090093659/dsh-web-ui