dsh-chart-lab
66-zhimeng/dsh-chart-lab
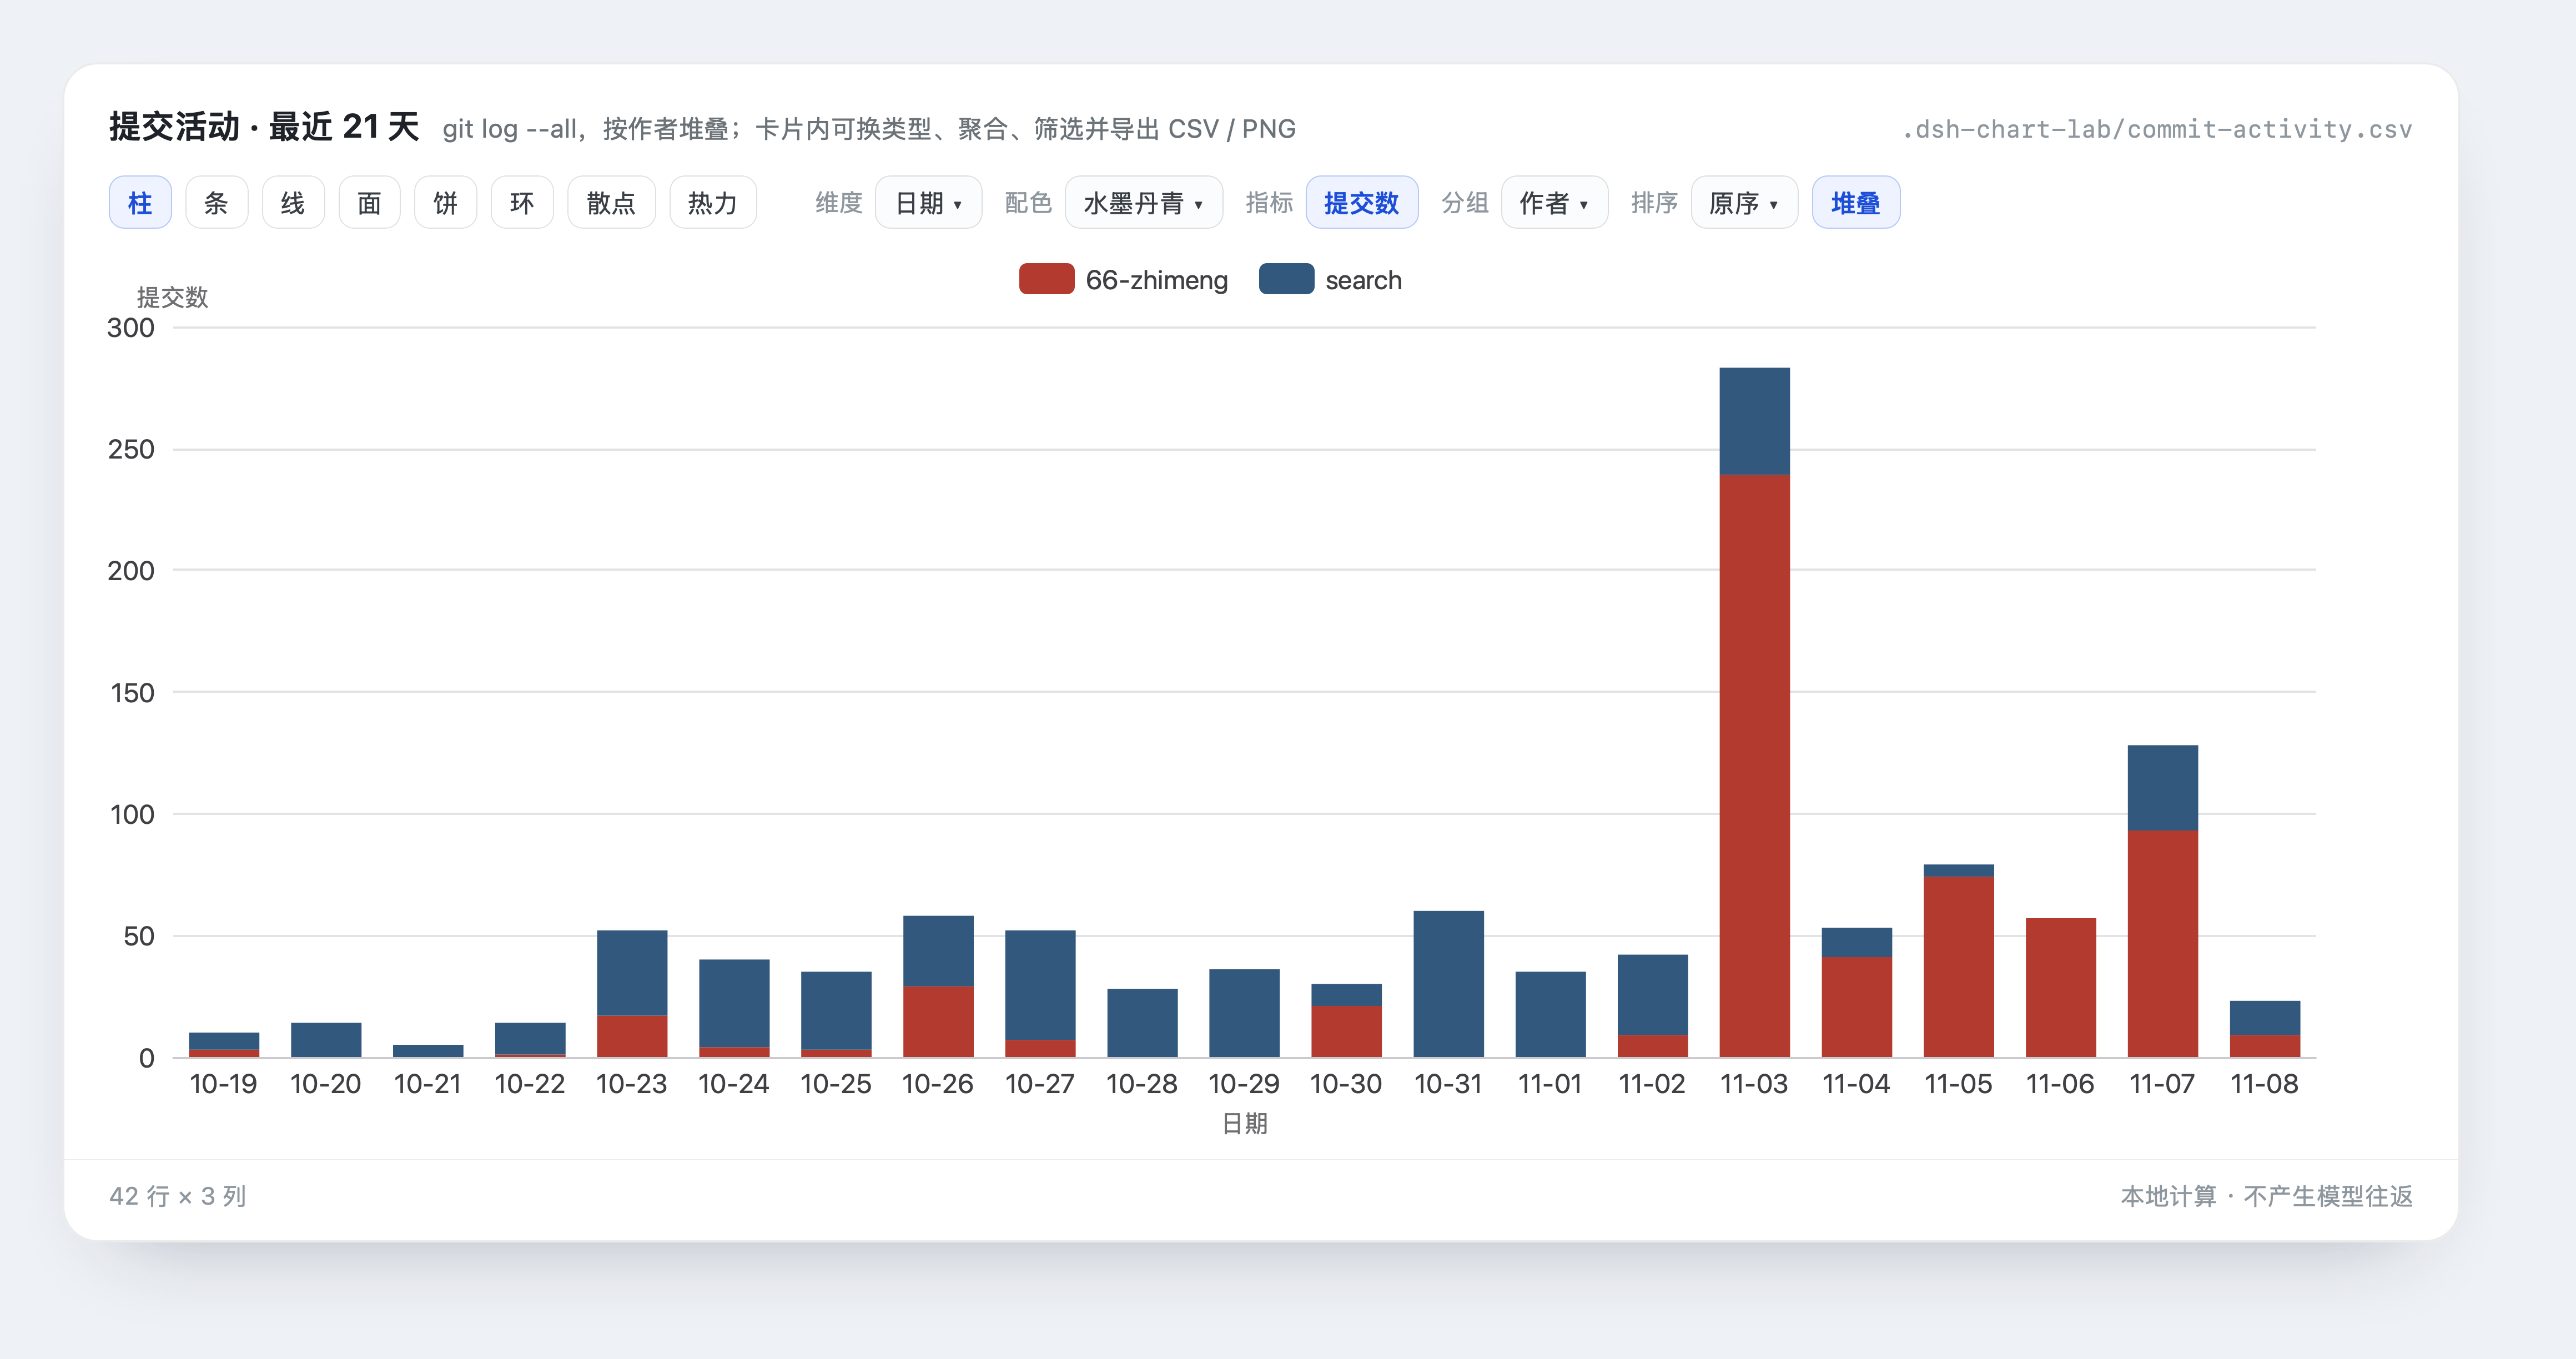
对话里的可交互图表卡片:数据由宿主从工作区读取,浏览器卡片本地切换图表类型、维度、聚合、筛选、Top-N 与配色,并可导出 CSV / PNG,全程不产生模型往返。
安装
dsh plugin --profile web add github:66-zhimeng/dsh-chart-labREADME

dsh-chart-lab
Interactive ECharts cards for DeepSeek Harness (dsh).
In one line: the host loads your dataset from the workspace, the browser card does all the slicing — and clicking a button costs zero tokens and zero model turns.
English | 中文
Why
Generative-UI plugins usually route every interaction back through the model: one click = one full model call, a regenerated card, and a growing history. That is fine for a form, and ruinous for a chart you want to explore.
chart_lab splits the two audiences apart:
| model sees | card sees | |
|---|---|---|
after execute() | a one-line summary (~220 bytes) | the full dataset |
| per interaction | nothing | a local recompute (~5 ms for 50k rows) |
So a 50,000-row file costs the model a dozen tokens, and switching chart type, changing the dimension, filtering, or re-aggregating never reaches the model at all.
How it works
model  ──chart_lab({file, recipe, chart})──▶  host (node)
                                               │  execute(): read file, parse, infer column types
                                               │
       ◀── render(): one-line summary ─────────┤
                                               │
       presentationMeta(args, value) ──────────┴──▶  full dataset + recipe source
                                                             │
                                                             ▼
                                          browser: keyed `tool.call.toolview`
                                          (everything from here is local)
The hinge is the second argument to output.presentationMeta(args, value): it receives execute()'s return value, so the host can hand the browser a payload the model never sees. output.render narrows the same result to the single line that enters the prompt.
Install
dsh plugin --profile web add github:66-zhimeng/dsh-chart-lab
(Not on npm yet; once it is published, dsh plugin --profile web add dsh-chart-lab will work too.)
Then make sure dsh-chart-lab appears in dsh.profile.bundles in $DSH_HOME/profiles/web/package.json (dsh plugin add normally reconciles this for you) and restart dsh web.
To hack on it locally, clone the repository and link it instead:
git clone https://github.com/66-zhimeng/dsh-chart-lab
cd dsh-chart-lab && npm install
dsh plugin --profile web add link:$PWD
Requires Node ≥ 22. ECharts is a normal dependency, fetched by your package manager and served lazily by the plugin's own route — it is not bundled into the client payload.
Tool arguments
| argument | meaning |
|---|---|
file | dataset path inside the workspace: .json / .ndjson / .jsonl / .csv / .tsv. Preferred — never enters the model's context |
pick | dotted path into a JSON document, e.g. "result.series" |
rows | inline rows; only for a few dozen rows |
url | JSON endpoint fetched host-side |
recipe | path to a workspace JS file adding custom controls and transforms |
chart | initial view: {type, x, y[], agg, group, topN, sort, stack, xName, yName, unit} |
title / note | card heading and subtitle |
Paths may not escape the workspace root (the directory dsh was started in).
Accepted document shapes: a plain array, a {rows|data|items|records|list|result: [...]} wrapper, a column-oriented {a: [...], b: [...]} table, or a single record.
What the card can do — all locally
Chart type (bar / horizontal bar / line / area / pie / donut / scatter / heatmap / table) · dimension · multi-metric selection · aggregation (sum / avg / count / median / min / max / raw) · split-by column · category filter chips · sort · Top-N · stacking · smoothing · drag-to-resize · CSV and PNG export · reset.
ECharts contributes legend toggling, tooltips with a crosshair, and wheel/drag zoom with a slider once a view exceeds 24 categories.
Axis captions are derived from the selected columns, so they follow the dropdowns without model involvement. A unit written into the column name — Output(t), 能耗(kWh), latency[ms] — is detected automatically and appended to the axis and the tooltip; chart.unit overrides it.
Card state is keyed by tool call id, so scrolling away and back does not reset it.
Artifact cards (kept out of folded work details)
A chart is an output, not process. A tool result may declare itself one:
// lib/tool.js
return { ...payload, artifact: true }
The chat layer then keeps that node outside the completed Turn's folded work details and outside collapsed step groups.
That behaviour needs a local patch to the installed dsh bundle until the contract exists upstream:
node patches/artifact-results.mjs           # apply
node patches/artifact-results.mjs --check   # status
node patches/artifact-results.mjs --revert  # restore
The first apply backs the original bundle up as client.js.orig; re-run it
after upgrading dsh, then refresh the page.
Control bar policy
Controls that cannot change the current picture are not rendered: no stacking for a single series, no Top-N below nine categories, no aggregation when the dimension is unique, no sorting below three categories, smoothing only for line/area. A button that does nothing is worse than a missing one.
The colour picker offers six schemes (default, ink, Dunhuang, celadon, Morandi, vivid); switching redraws locally without another model turn.
Recipes: project-local processing code
A recipe is a JS file in your own repository (.dshviz/recipes/*.js by convention). It is a function body that returns an object:
return {
  controls: [
    { id: 'win',    kind: 'select', label: 'Window', options: [['3', '3d'], ['7', '7d']], value: '3' },
    { id: 'showVal', kind: 'toggle', label: 'Labels', value: false },
    { id: 'floor',  kind: 'slider', label: 'Floor', min: 0, max: 100, step: 5, value: 0 },
    { id: 'redo',   kind: 'button', label: 'Recompute' },   // value is a counter
  ],
  transform({ rows, controls, state, columns, h }) { return rows },      // optional
  option({ option, rows, view, controls, state, h }) { return option },  // optional
}
controls— this recipe's control values. Prefer this overstate.state— built-in view state, withcontrolsmerged over it.h—sum / avg / median / min / max / num / label / uniq / groupBy / parseDate / fmt.- Both functions run in the browser; moving a control re-runs only them.
- A throw is contained:
transformfalls back to the untransformed rows with a warning on the card,optionfalls back to the built-in configuration.
Reserved control ids — type, x, y, agg, group, topN, sort, stack, smooth, filters, view, height. These name built-in controls; reusing one shadows it in state and makes the corresponding built-in button appear dead. The card warns when it happens. Chart type, smoothing, stacking, filtering, Top-N, sorting, and aggregation already have built-in buttons — a recipe should only add what they do not cover.
Runnable examples live in examples/.
Development
No build step: lib/*.js is what runs. The node half is ESM; the client half is hand-written CJS inside the __ModuleLoader__.load wrapper, so it can be patched in place like any other installed dsh plugin.
npm install
npm test        # 42 data-engine assertions + 16 jsdom interaction assertions
scripts/test-client.mjs covers the aggregation pipeline, recipe evaluation, and option building. scripts/test-interaction.mjs mounts the real card in jsdom, clicks the controls, and asserts the chart is actually redrawn — the suite that catches "the button highlights but nothing happens".
Limits
- 200,000 rows per card; beyond that the payload is evenly sampled and the card says so.
- The dataset is persisted with the session log as the result node's
meta, so a page reload keeps the card working — but very large datasets make the log large. - Recipes are trusted project code evaluated with
new Function. There is no sandbox. - No SQL source: export to a file first, or point
urlat an endpoint you already have.
License
MIT. ECharts is a dependency under Apache-2.0 and is not redistributed by this repository.