dsh-usage-dashboard
alphazer01214/dsh-usage-dashboard
DSH 侧边栏用量仪表盘:跨会话 token、模型与活动统计,含按会话明细与趋势图。
安装
dsh plugin --profile web add github:alphazer01214/dsh-usage-dashboardREADME
dsh-usage-dashboard
English | 中文
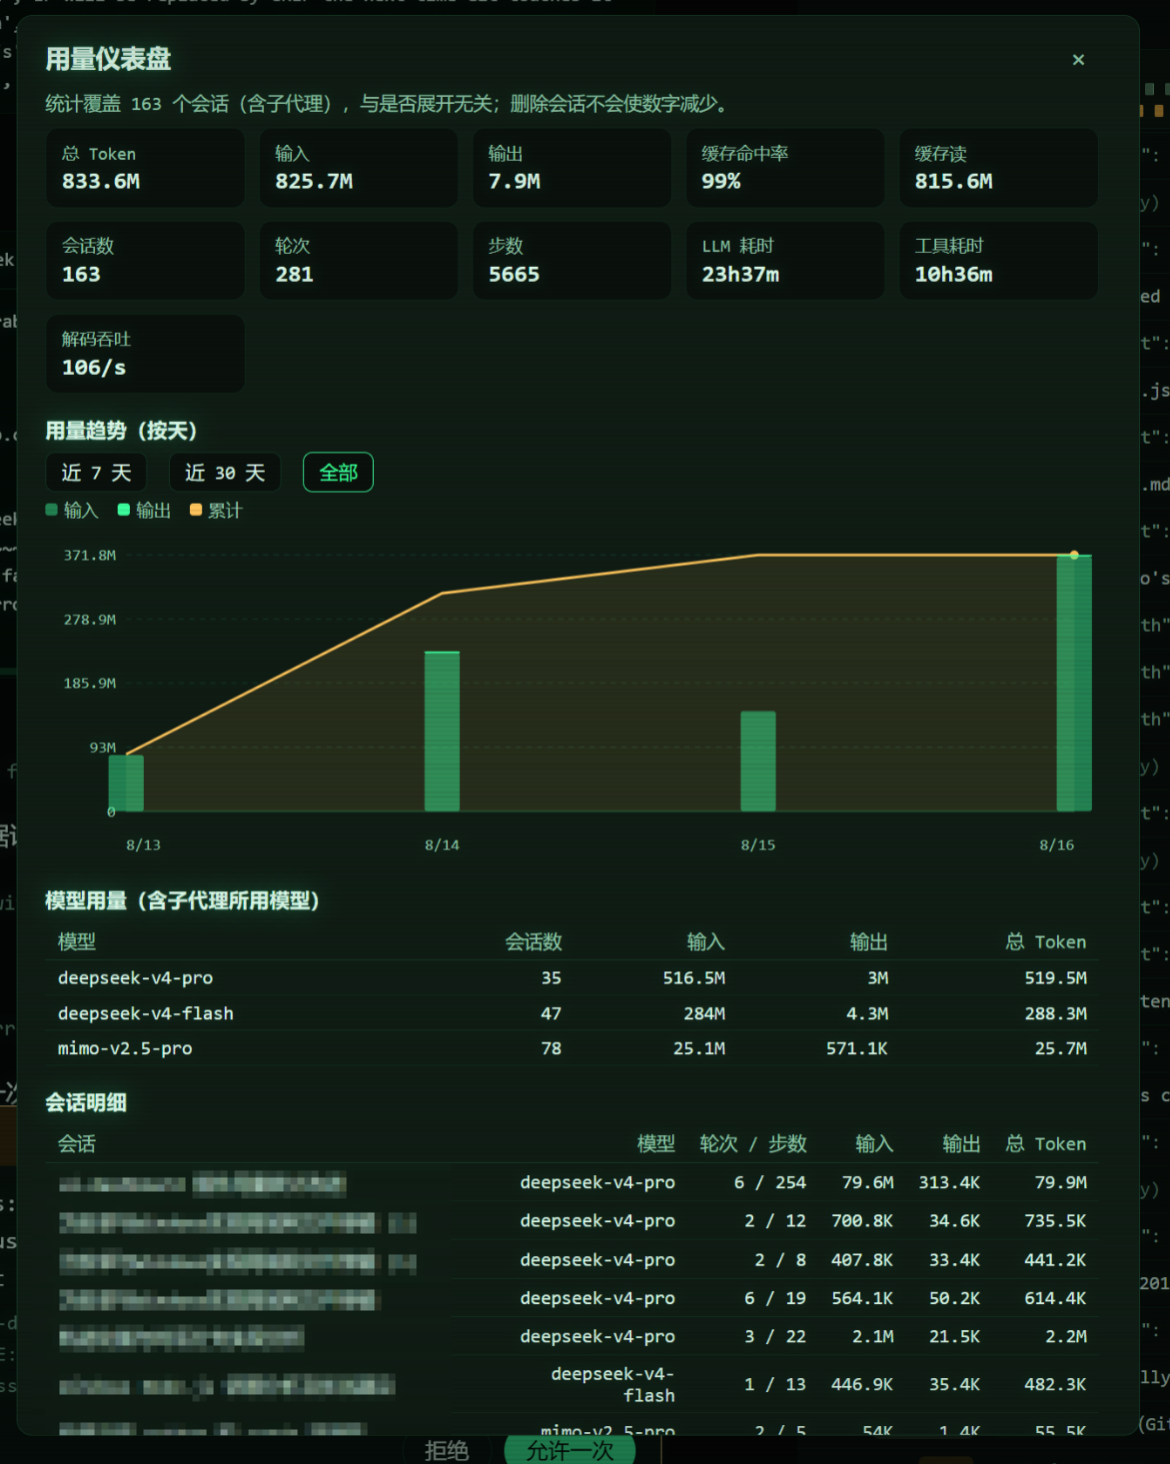
A usage dashboard for DeepSeek Harness web deployments, shipped as a first-class composition plugin (one host half, one trusted browser half). It replaces the sidebar's built-in usage dialog with a durable, deployment-wide usage ledger that fixes the built-in dashboard's four structural problems:
- No manual expansion. The built-in dashboard folds only the sessions the browser has loaded. This plugin backfills every persisted session straight from the session logs at activation, then folds every committed event live — nothing needs to be opened first.
- Deleting a conversation never reduces the totals. The ledger lives in its
own storage domain (
usage_dashboardin the harness storage root), completely separate from the session logs and their projection caches. - Backup and migration. The dialog exports the whole ledger as one JSON document and imports it again — importing into a fresh deployment restores the full history, and re-importing the same backup never double counts.
- Exact numbers — no more, no less. The fold mirrors the harness's own
tokenUsage/sessionStatsprojection semantics field-for-field (verified against the harness folds over randomized event sequences): same-step usage samples replace instead of adding, fork/subagent seed prefixes are skipped so an ancestor's history is counted exactly once, and every write is cross-checked against the livetokenUsageprojection with a loud mismatch log.
It also records the models used by subagents (each subagent is its own session, attributed to its parent), and draws the usage trend per day — stacked input/output bars plus a cumulative line, with 7-day / 30-day / all windows.
Why a composition plugin (and no approval dialog)
The earlier releases installed the dashboard as a dynamic Cordis package
per session (via the autoload/ loader). Dynamic browser halves are gated by
the harness's client-code activation policy, so every harness start showed a
Cordis approval dialog for usage-dashboard in every session. This release
mounts the same host ledger and the same sidebar dialog as ordinary
composition rows in the web profile patch: the browser half is part of the
trusted page composition, so no dynamic plugin is defined, nothing is
approved, and no dialog ever appears. The ledger data itself is unchanged
and carries over seamlessly.
Requirements
A DeepSeek Harness web-profile deployment that mounts storage-domain,
session-persistence, and webServer (the standard web bundle does). The
plugin reads only public services — it changes no harness code.
Installation (per deployment)
-
Build the deployable package (or use a release's prebuilt
lib/):node scripts/build.mjs # emits lib/index.js (host) + lib/client.js (browser bundle) -
Copy the package into the profile's packages directory:
cp -r . "$DSH_HOME/profiles/<profile>/packages/dsh-usage-dashboard" -
Add the dependency to
<profile>/package.jsonand link it:"dependencies": { "dsh-usage-dashboard": "file:./packages/dsh-usage-dashboard" }then run
pnpm installin the profile directory. -
Append to
<profile>/cordis.patch.yml:# Usage dashboard: durable cross-session ledger (host) + trusted sidebar # dashboard (browser). No dynamic-plugin approval is involved. - insert: - id: usage-dashboard name: dsh-usage-dashboard # Keep only the most feature-complete dashboard: disable the shipped # projection-only footer action (same sidebar cell). - id: ui-dashboard disabled: true -
Restart the harness. The sidebar now shows a single 用量 action backed by the durable ledger, for every session, with no approval prompts.
What the dialog shows
- Stat cards — total / input / output tokens, cache-hit share, cache read/write, session count, turns, steps, LLM and tool wall time, decode throughput.
- Usage trend (per day) — stacked input/output bars with a cumulative line, legend, dashed gridlines, sparse date ticks, and window selection.
- Model usage — per-model totals including the models subagents billed, with distinct-session counts.
- Session table — per-session tokens, newest billed model, turns/steps, with a 子代理 badge for subagent sessions.
- Backup & migration — export (copy the JSON document to a file) and import (paste a backup and merge it).
Data semantics
- Each ledger record is keyed by
sessionId@createdAtand carries the folded state (per-day and per-model token buckets, turns/steps/timings, newest billed model) plus a seq watermark. Records only ever advance: writes are serialized per key and a lower-watermark snapshot can never regress a stored record. - A session's own suffix starts at its header's
seedLength: fork and subagent children count exactly what they themselves billed, and the inherited prefix stays attributed to the ancestor — the totals are the true billed usage with no double counting anywhere in a fork tree. - Live sessions fold through
session/eventlisteners registered with{ global: true }(at the host root this is the default view anyway; the flag keeps the code scope-independent). Activation heals every stored tail, materializes live cells, and the report additionally backfills any session the ledger has never seen, so the report is complete even for sessions created while the plugin was stopped. - The backup document is
{ format: 'dsh-usage-dashboard-backup', version: 1, exportedAt, records }. Import validates every record and merges by key: a record is adopted only when its seq is higher than the stored one, so repeated imports are idempotent. - The browser half fetches
/usage-dashboard/report,/usage-dashboard/export, and/usage-dashboard/import(same-origin webServer routes registered by the host half) — the dynamic runner'sharness.handle/host.callchannel does not exist for composition rows.
Known limitations
- Backup travels as text. Export renders the JSON document in a textarea (copy it to a file); import accepts the same JSON pasted back.
- Day buckets use the host's local calendar. Totals never depend on the bucket; only the trend chart's grouping does.
- Sessions whose logs were deleted before the plugin ever ran cannot be reconstructed — there is nothing left to fold. Everything present in the store is counted.
- Per-session titles are joined from the live session list when available; sessions no longer in the list (e.g. deleted) show a short id.
Repository layout
src/host.js— the canonical host-half module (ledger, heal/backfill, report/export/import webServer routes).src/client.js— the canonical browser-half module (sidebar action and dialog;Reactis provided by the bundle wrapper).scripts/build.mjs— generateslib/index.jsandlib/client.jsfrom the sources (the browser bundle is awindow.__ModuleLoader__.load({ id, factory })handoff).package.json— the deployable package manifest (dsh.clientdeclares the web browser half;exports["./client"]points at the bundle).