dsh-visualizer
moses14159/dsh-visualizer
DSH 外部插件:模型在对话流中流式渲染 SVG/HTML Widget(沙箱 iframe)与 echarts 结构化图表,不改 DSH 源码。
安装
dsh plugin --profile web add github:moses14159/dsh-visualizerREADME
dsh-visualizer
English · 简体中文
An external plugin that does not modify DSH source: lets the model render visuals on the fly in the conversation — streaming SVG/HTML widgets and structured charts (ChartSpec → echarts).




What is this
Inside a DSH (DeepSeek Harness) conversation, let the model produce visual content directly and render it safely into the chat:
- Structured charts — the
specof thevisualizetool, rendered with echarts (line / bar / area / pie / scatter). - SVG / HTML widgets — the model writes ```svg / ```html fences that render token-by-token, streaming into a sandboxed iframe; it can also deliver a complete widget via the
widgetparameter ofvisualize.
It reuses DSH's existing assistant/chunk and tool/call + tool/result events, and does not change DSH source.
Features
- Two kinds of output, three delivery paths:
visualize(spec)for charts; ```svg / ```html fences in the message body for streaming widgets;visualize(widget)for a complete widget. - Streaming render: reuses the existing
assistant/chunkevents to get token-by-token output, so the widget updates frame by frame as the text streams. - Two-sided validation: host
executeand the client fold share the same pure-function parsers (chartspec/widget), so model drift cannot silently pass through. - Security isolation: widget code is inserted verbatim into a
sandbox=""iframe + CSPdefault-src 'none'; there is no sanitizer to bypass. - Rendering experience: charts sample the
--dsw-alias-*tokens; SVG widgets size to their intrinsic aspect ratio; cards carry a "fit / 1.5× / 2×" zoom and a status badge (generating / truncated / done). - Graceful degradation: any validation or render failure leaves no blank row and throws no error — it falls back to a plain code block or a JSON card.
- Pure, testable: the core logic is all DSH-free pure modules — 97 unit tests run standalone in Node.
Preview
Real conversation screenshots (rendered inside the DSH Web client):
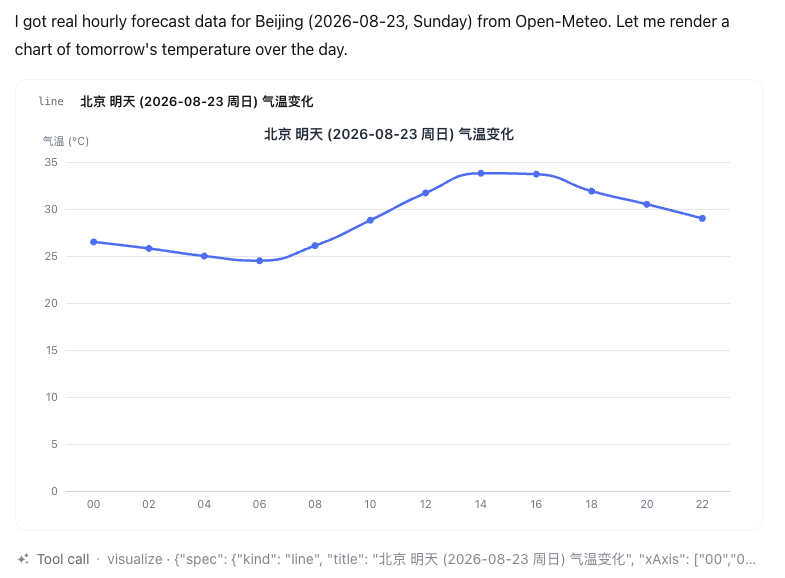
Structured chart ·
visualize(spec) → echarts (follows the DSH theme)
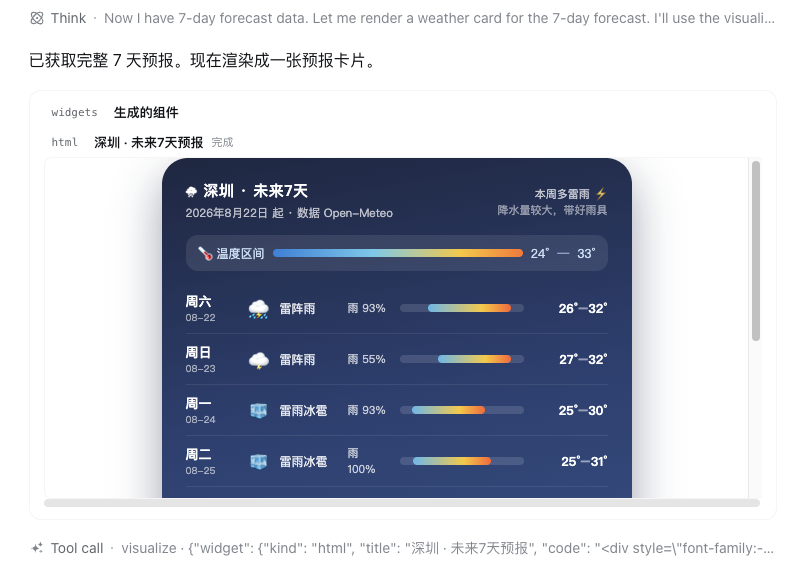
Widget ·
visualize(widget) → sandboxed iframe
More render samples (rendered by the plugin's own code):
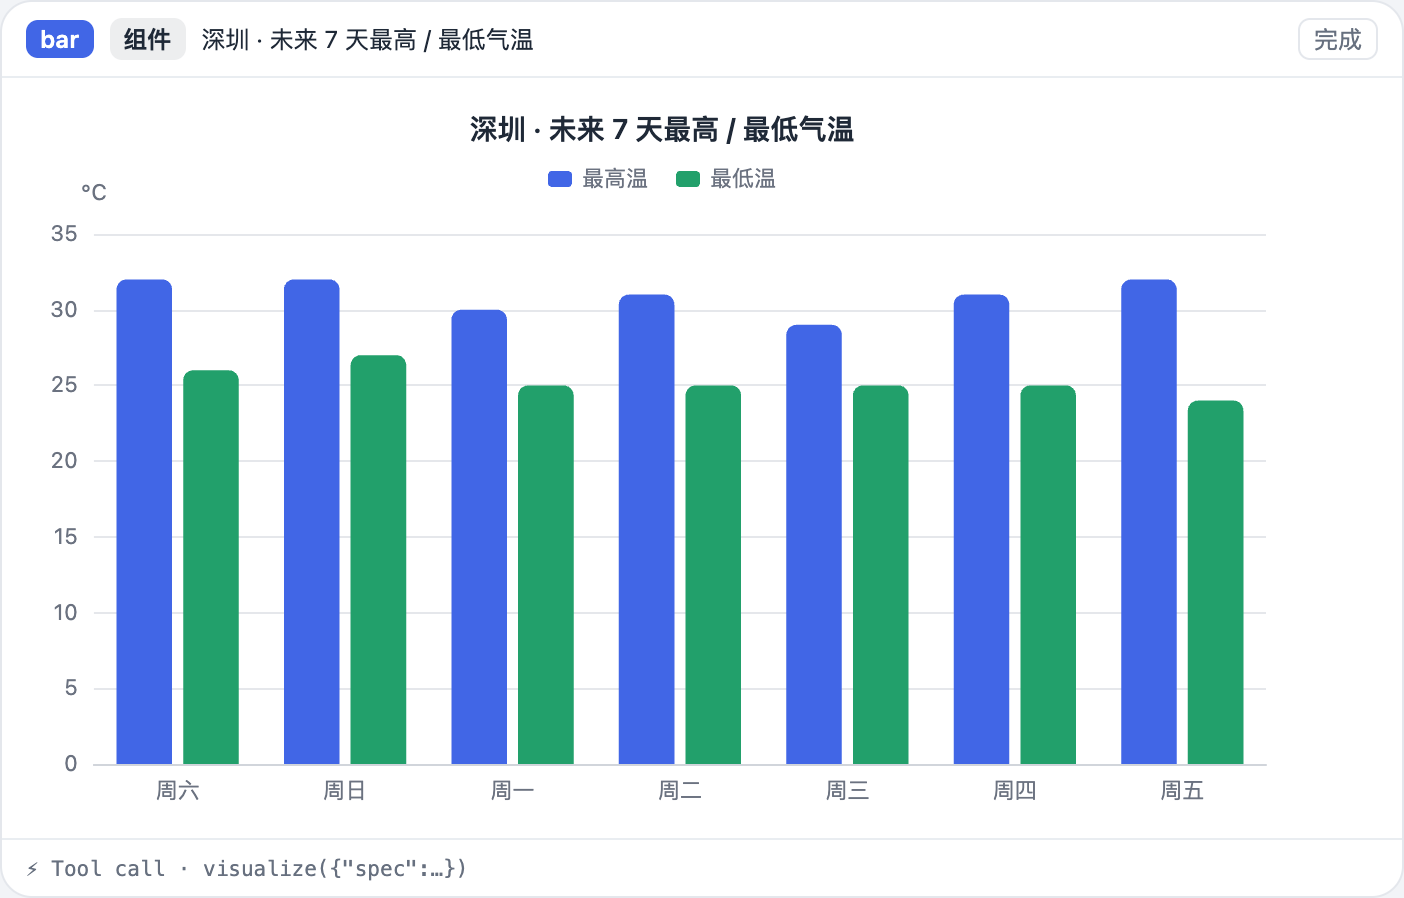
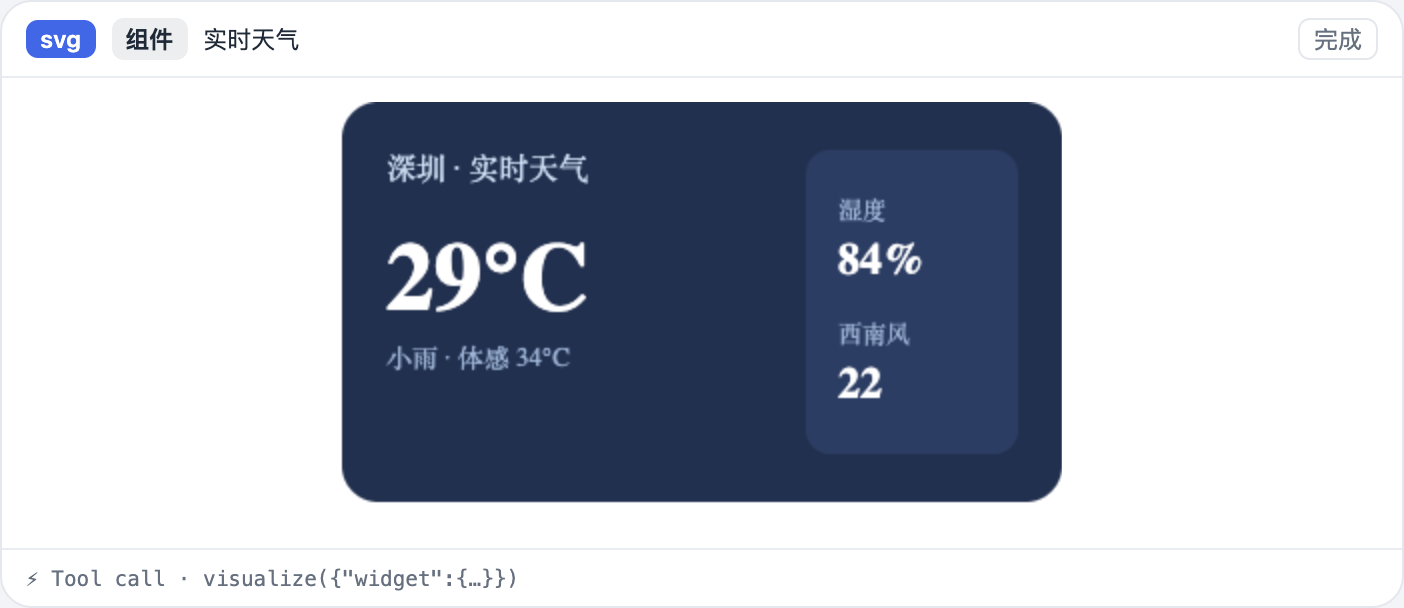
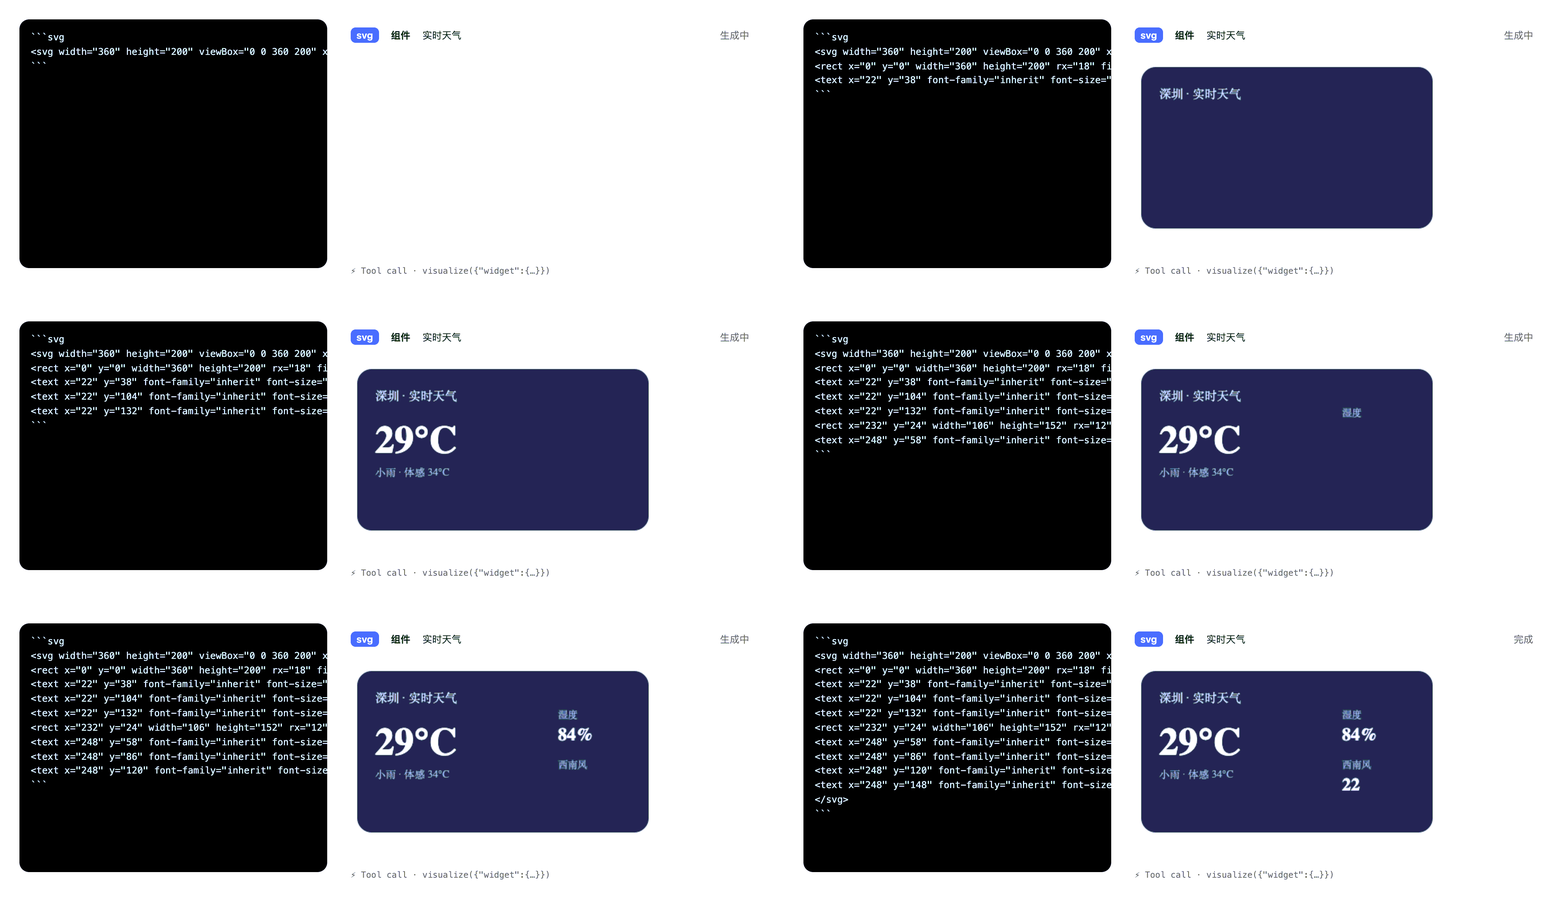
Left: bar chart · Right: SVG widget · Bottom-left: HTML widget · Bottom-right: streaming render (```svg fence updated token by token)
Installation
Install directly from GitHub (recommended — the built artifacts are committed):
dsh plugin --profile web add github:Moses14159/dsh-visualizer
Alternatively, clone it and install from the local path:
git clone https://github.com/Moses14159/dsh-visualizer.git
dsh plugin --profile web add /path/to/dsh-visualizer
- Plugins installed from Git build via their
preparescript on install. For safety, pnpm blocks build scripts; if it prompts you, add the relevantallowBuildskey to the profile'spnpm-workspace.yamland re-run.- Once
dsh-visualizeris published to npm, you can also install it by name:dsh plugin --profile web add dsh-visualizer.- Requires DSH (
deepseek-harness) installed locally and a workingdsh web. It depends on DSH's@deepseek-ai/dsh-client-runtime,@deepseek-ai/dsh-llm,@deepseek-ai/dsh-tools(seepeerDependencies).
Usage
After installing, just tell the model in the conversation:
- Say "draw a chart with visualize" → the model calls
visualizewith aspec; - Say "write an SVG badge / HTML widget" → the model streams ```svg / ```html fences directly in the reply, and you see it render frame by frame as it generates;
- The model can also pass a
widgetparameter tovisualizeto deliver a complete widget (validated, persisted, and replayable on the host).
Tool payloads
visualize takes exactly one of:
// Structured chart
{ "spec": {
    "kind": "bar",                    // bar | line | area | pie | scatter
    "title": "Shenzhen · 7-day temperature",
    "xAxis": ["Sat", "Sun", "Mon", "Tue", "Wed", "Thu", "Fri"],
    "yName": "°C",
    "series": [{ "name": "Max", "data": [32, 32, 30, 31, 29, 31, 32] }]
} }
// SVG / HTML widget
{ "widget": { "kind": "svg", "code": "<svg ...>…</svg>", "title": "Card title" } }
Streaming fence
```svg
<svg width="360" height="200" viewBox="0 0 360 200" xmlns="…">
  …rendered token by token…
</svg>
```
Examples
Say these directly in the conversation to see the effect (the images are from real conversations).
Generate a weather card
Help me generate a weather card for Shenzhen right now
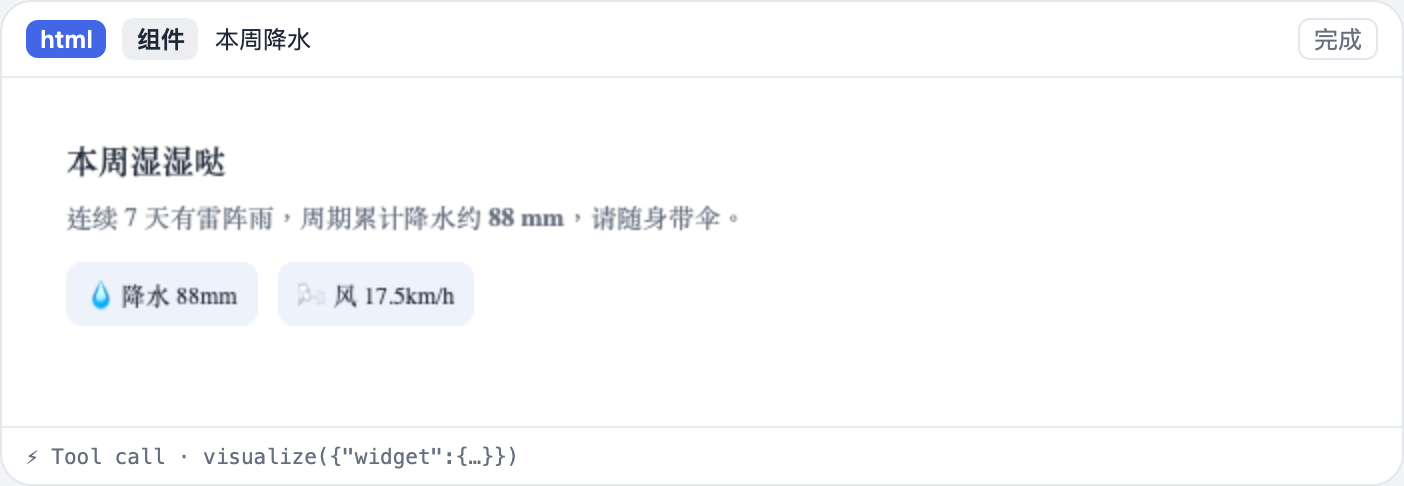
The model calls visualize with a widget (HTML) and renders it as a sandboxed widget card:
visualize(widget) · an HTML card rendered in a sandboxed iframe
Draw a line chart
Use visualize to draw a chart of tomorrow's 24-hour temperature change in Beijing
The model passes a spec (line) and renders it with echarts:
visualize(spec) · echarts render (follows the DSH theme)
Render as it streams
Write an SVG card for Shenzhen's current weather
The model writes a ```svg fence in the reply and renders it as it streams:
a ```svg fence in the reply · token-by-token streaming render
Ask for several at once
Draw a bar chart, a pie chart, and a weather card at the same time
The model calls visualize multiple times and lays out the charts and widgets in the conversation flow.
💡 Tip: these examples require the model to have the
visualizetool loaded (registered once the plugin is installed). If the model doesn't reach for it, just describe what you want — it will prefer callingvisualize.
Architecture
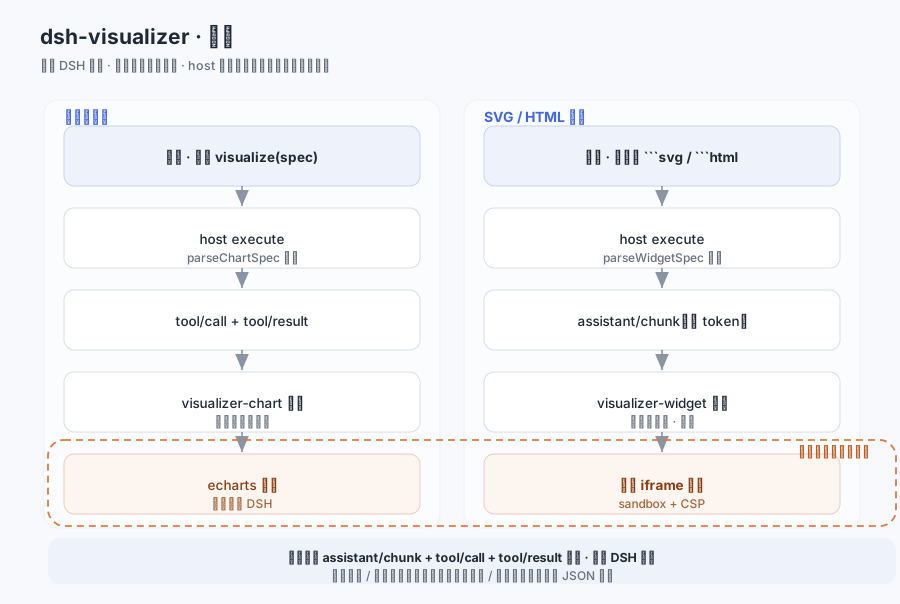
Two delivery paths
| Output | Trigger | Session events | Folded into | Render |
|---|---|---|---|---|
| Structured chart | visualize(spec) | tool/call + tool/result | visualizer-chart | echarts |
| Widget (delivered) | visualize(widget) | tool/call + tool/result | visualizer-widget | sandboxed iframe |
| Widget (streamed) | ```svg / ```html fences | assistant/chunk | visualizer-widget (frame updates) | sandboxed iframe |
Why this shape works (source-level facts)
assistant/chunkis an existing session event family: the agent-loop logs eachStreamChunkas{ turn, step, chunk }, and the web client's streaming text is exactly a fold of these events — the plugin reuses the same stream to obtain token-by-token output, without adding a new host-side event family.conversationEventsis a cordisServicean external plugin can inject;visualizer-widgetfolds the same batch ofassistant/chunkevents in parallel with the built-inassistant-step, without interference.conversation.chat.nodeis a keyed slot (replaceRisk: 'none'); registering a string key —{ key: 'visualizer-chart' | 'visualizer-widget' }— is an additive contribution.ChatNodeViewProps/ConversationNodeDefinition/ChatNodeDataMapare all pure types, erased at build time, so they don't trip the client bundle's purity gate.- Determinism:
matchreads only the current event; every event of one Context carries or independently derives the same stable id (step:<turn>:<step>/widget:<callId>);updatefolds one Match per logseq, so it is replayable.
Security boundary
| Layer | Handling |
|---|---|
| Model → spec / widget | host execute validates with parseChartSpec / parseWidgetSpec; invalid payloads are rejected (the tool errors) |
| Text stream → widget | the client WidgetScanner only recognizes line-leading ```svg / ```html fences; widget code is not markup-validated (any byte can be a legal prefix while streaming), so the security boundary lives at the render side |
| session log → client | the Definition's update/fallback re-parses the result text; the full assistant/message is the cold-replay recovery source |
| Render (widget) | two layers of isolation: iframe sandbox="" (no scripts / same-origin / forms / popups / navigation, opaque origin) + an injected CSP default-src 'none' in the srcdoc; code is inserted verbatim, so there is no sanitizer to bypass |
| Render (chart) | ChartSpec is pure data → echarts setOption; no HTML/SVG injection surface |
Any validation or render failure degrades (the node isn't rendered / the fence stays a plain code block / a JSON card) — never a blank row or a thrown error in the chat.
Payload limits
- Charts: ≤ 8 series, ≤ 500 points, ≤ 120 characters per label;
- Widgets: ≤ 128 KB per item (UTF-8), ≤ 12 items / ≤ 512 KB total per node; overflow is truncated or omitted and shows a "truncated" badge.
Development
pnpm install
pnpm test        # pure-function unit tests (97 cases)
pnpm typecheck   # tsc --noEmit
pnpm build       # tsdown: host + replay + both channel client bundles
pnpm render-demo # regenerate docs/ demo images (needs a local Chrome)
- The pure-function modules (
chartspec/widget/to-echarts/to-iframe/svg-geometry/ the two folds) don't import DSH or touch the DOM, so they can be tested standalone in Node. - The client entry is
src/client/index.tsx; the host tool entry issrc/index.ts.
Known limitations
- Charts still appear "whole": ChartSpec is delivered via a tool call, so there is no token-by-token streaming chart (tool arguments aren't streamable); the fence widgets are the streaming path.
- The fence source and the widget card coexist: the code block the model writes still renders as a normal markdown code block (as the "source" view), while the widget card renders in the stream — they are not mutually exclusive.
- Widgets are static: the sandbox disables scripts, so interactive components (button logic, animated scripts) won't run; use a chart or a purely presentational widget when you need interaction.
- No mermaid: v1 supports only svg/html fences; render mermaid diagrams as plain code blocks or in a later version.
- Fences must be at line start (≤ 3 spaces of indent); an inline ```svg is not a fence, and a lone ``` line inside the content closes the fence (CommonMark semantics).
- echarts is lazily
import('echarts')and inlined into the client bundle (the registry route serves a single file, so it can't be code-split yet).
Compatibility
- Node:
>= 20; DSH: loaded through the external-plugin mechanism (profile bundle patch). - peer dependencies:
@deepseek-ai/cordis,@deepseek-ai/dsh-client-runtime,@deepseek-ai/dsh-client-ui-conversation,@deepseek-ai/dsh-llm,@deepseek-ai/dsh-tools,react,react-dom.
License
MIT · Copyright (c) 2026 Moses14159