dsh-system-monitor
shiro-umi/dsh-system-monitor
输入框底栏监控插件,含 5 枚可拖拽重排胶囊(Context、Tokens、CPU、GPU、MEM):20x5 上下文方格矩阵、当轮净上传/下载 Token 分步柱图,以及 200ms 原生 macOS Mach/IOKit 滚动柱状图与前 5 进程列表。原生采样器首次启动时现场编译,需要 clang(Xcode 命令行工具);没有则退回每秒一次的采样。
安装
dsh plugin --profile web add github:shiro-umi/dsh-system-monitorREADME
System & Session Monitor
Five pills in the DeepSeek Harness composer dock. Context, tokens, and live system readings share one row. Click any pill to open its card.



English · 中文

The five pills
| Pill | Live reading | Card |
|---|---|---|
| Context | 5x3 micro grid and usage percentage | 20x5 brick matrix, system prompt / tool defs / messages split, cache hit rate |
| Tokens | Net upload and download per turn | Direction arrows, up/down ratio, up to 16 step bars, cache hit rate |
| CPU | User plus system load, with a 36 s bar chart | 60 s bar chart with peak line, user and system detail, top 5 processes |
| GPU | Device utilization, with a 36 s bar chart | 60 s bar chart with peak line, renderer and tiler detail, top 5 processes |
| MEM | Used and total, with a 36 s bar chart | 60 s bar chart with peak line, wired / compressed / floor rows, top 5 processes |
Drag any pill to reorder. The order persists in localStorage.
Cards
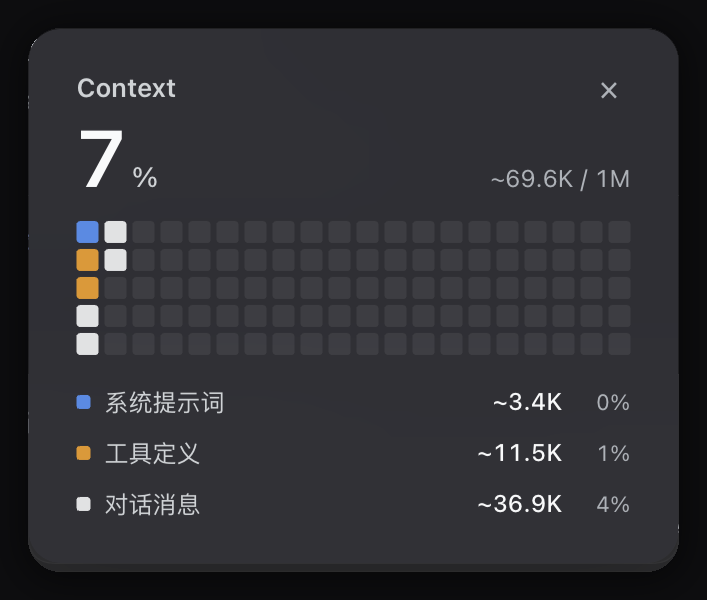
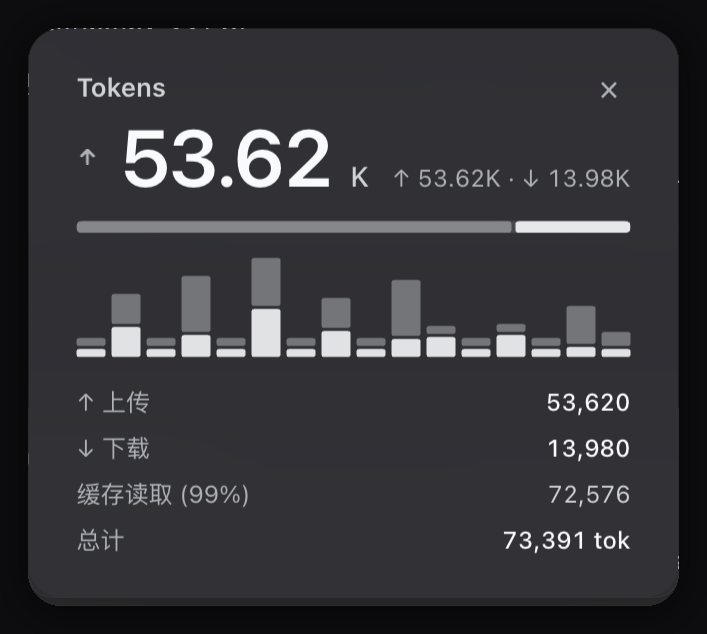
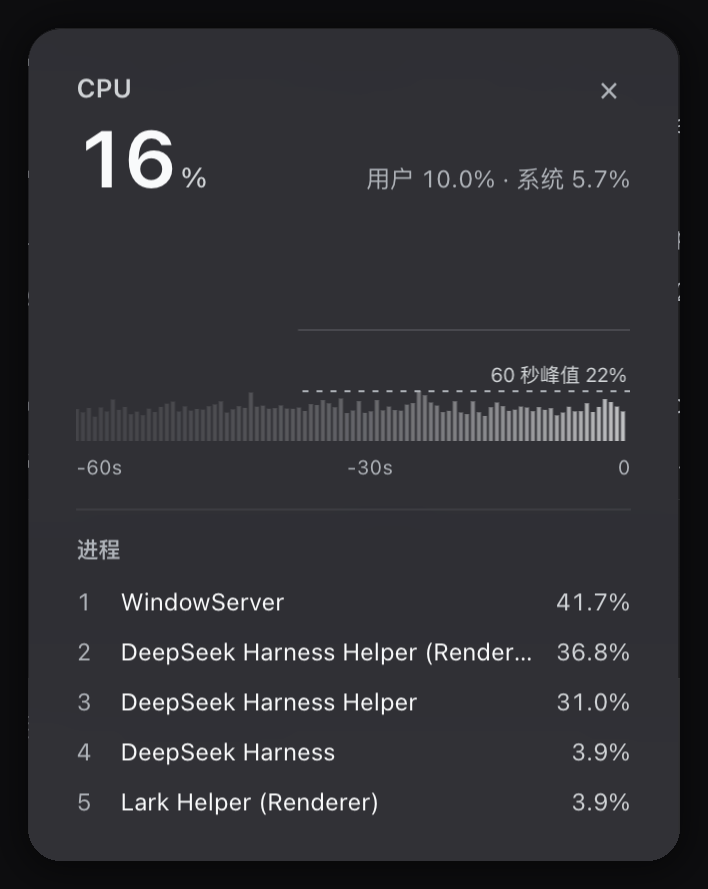
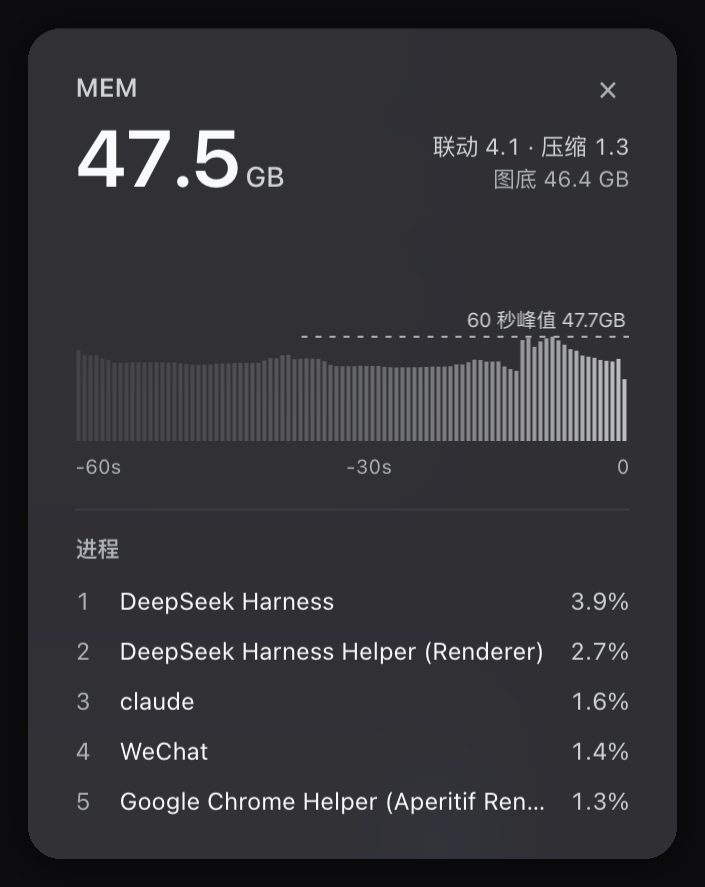

One card opens at a time. Click anywhere outside to dismiss.
Install
dsh plugin --profile web add github:Shiro-umi/dsh-system-monitor
Or install the release tarball:
dsh plugin --profile web add https://github.com/Shiro-umi/dsh-system-monitor/releases/latest/download/dsh-system-monitor.tgz
Link a local checkout while developing:
dsh plugin --profile web add link:/path/to/dsh-system-monitor
Restart DeepSeek Harness afterward.
Requires macOS and clang (Xcode Command Line Tools). On first start the plugin compiles sampler.c into bin/sampler. When the install directory is read-only it builds into the system temp directory instead.
Sampling
| Item | Value |
|---|---|
| Rate | One frame every 200 ms |
| CPU | Per-core tick deltas, split into user and system |
| GPU | IOAccelerator PerformanceStatistics |
| Memory | vm_statistics64, same basis as top PhysMem |
| Transport | NDJSON stream from the host |
| Idle stop | Sampler exits 5 s after the last subscriber leaves |
| Orphan guard | Sampler exits when the parent process is gone |
Fallbacks
| Condition | Behavior |
|---|---|
| clang missing | Frames built from top, ioreg, and sysctl once per second, LOW tag on the pill |
| Not macOS | Native sampler off, falls back to CPU and memory from node:os |
| Process query fails | Card shows a placeholder, metrics keep updating |
Slots
The plugin takes three entries in the composer dock. It replaces the built-in usage and activity indicators with its own five pills.
Develop
npm run check
npm test
npm test verifies the manifest, export map, client static invariants, card width math, and icon geometry.
License
MIT