stockproof (dsh-plugin)
taoqizhang55-code/stockproof/dsh-plugin
Stock research tools for US, China A-share and Hong Kong stocks via the stockproof MCP server (Python 3.10+; install with pip install "stockproof\[mcp,cn]" — A-share/HK data needs Python 3.11+): news, earnings and announcement reads with cited sources, explanations of price moves, a whole-market A-share screen, a quant lab that backtests ideas on point-in-time history with a locked holdout, a portfolio check-up and a local web dashboard; 23 tools.
Instalar
dsh plugin --profile web add github:taoqizhang55-code/stockproofEste plugin se encuentra en el subdirectorio dsh-plugin del repositorio.
README
stockproof · 有据
An LLM reads stock news, earnings reports and company announcements for you, with every point linked to its source. A research toolkit then checks each signal against years of prices, and the app tells you what that check found. US stocks, China A-shares and Hong Kong. English and 中文.


Try it offline in 30 seconds (no API key, no time limit). The demo opens the full dashboard on bundled real data; only buttons that need the internet or an AI model are turned off:
pip install stockproof
stockproof demo
No GitHub account or git needed. In mainland China, a mirror is faster:
pip install stockproof -i https://pypi.tuna.tsinghua.edu.cn/simple
Liked it? The 10-minute tour takes you from the demo to your own stocks, a backtest and a portfolio check-up.
What it does
Daily stock watching
| Command | What you get | |
|---|---|---|
| News mood | scan | Headlines for each stock, scored by an LLM for relevance and sentiment. Stories about other companies and repeats of the same event are dropped. |
| Earnings | earnings | The company's own release (SEC 8-K/6-K, Eastmoney for China) read by the LLM: tone, guidance, key points and risks, plus the earnings surprise (SUE) from point-in-time EPS. |
| Announcements | dashboard | A-share and HK filings are classified by importance (insider selling, regulator letters, buybacks, big contracts and more), and the important ones are summarized. |
| Why did it move? | dashboard | For an unusual move, the LLM explains it using only the news, filings and reports published around that day, cites each one, and says so when nothing explains the move. |
| What changed? | dashboard | The latest two reports compared: results, outlook, new risks, business and payouts. |
| Daily digest · calendar · schedule | daily, calendar, schedule | A daily summary of your watchlist, upcoming reports, and an automatic run every evening (macOS, Windows, Linux), with a desktop notification. |
Screen and scorecards
| Command | What you get | |
|---|---|---|
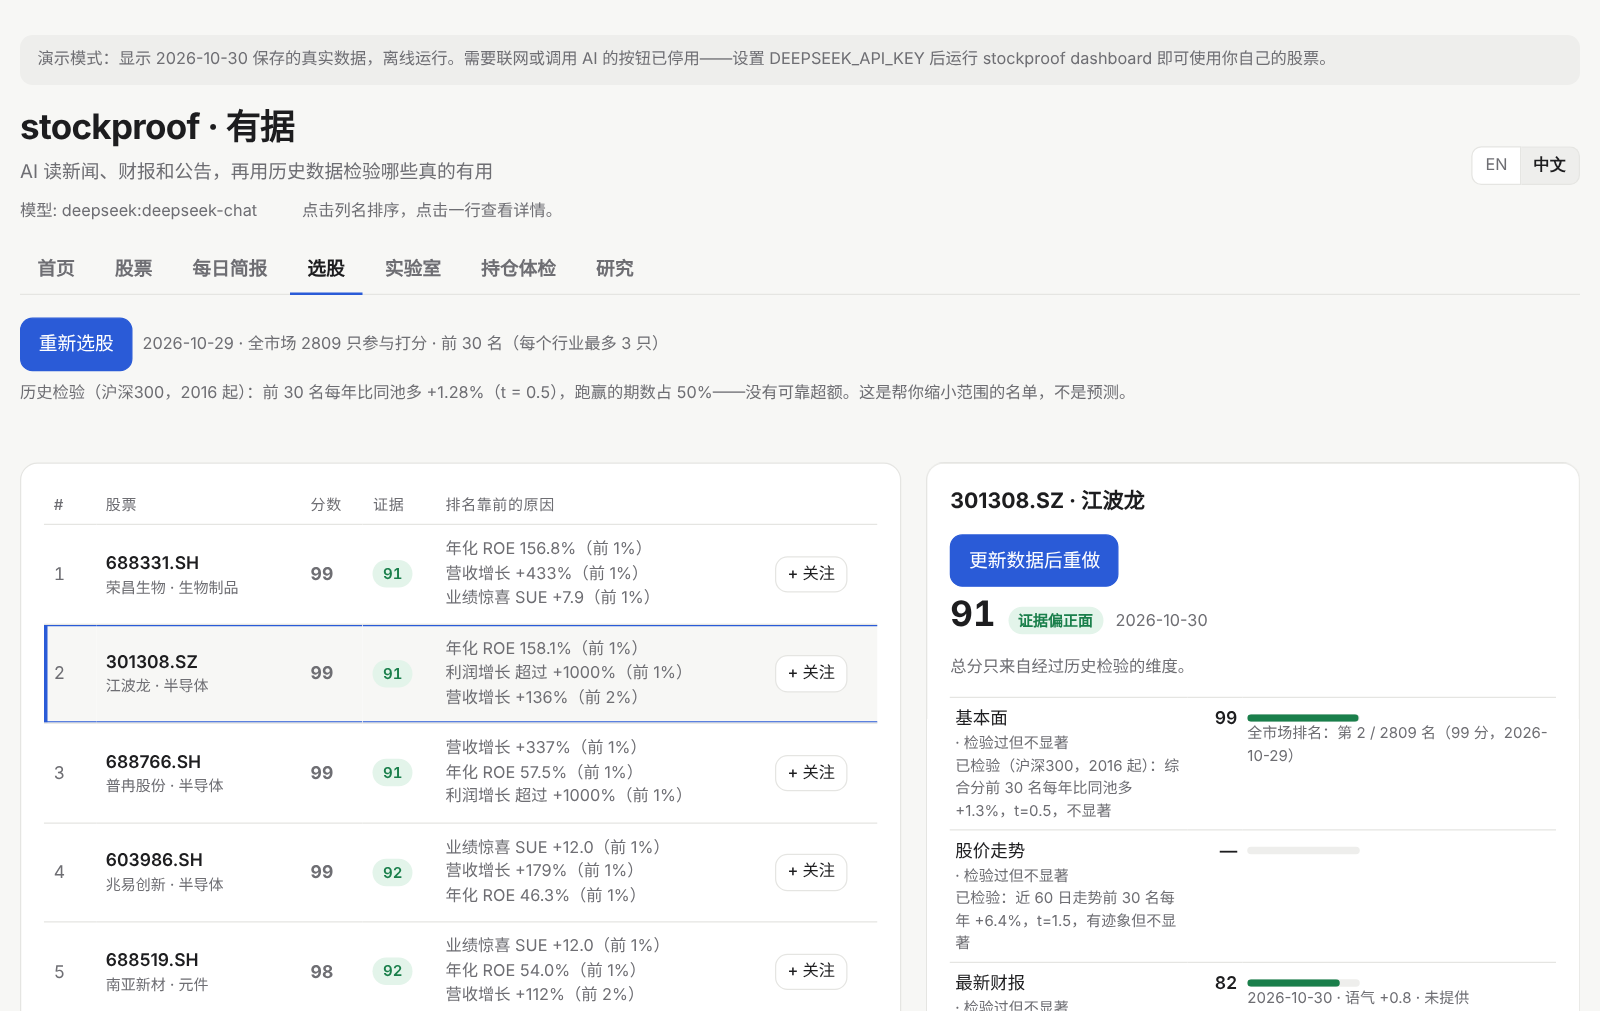
| Whole-market screen | screen | Every A-share ranked by earnings surprise, growth, ROE and trend, with at most 3 per industry and plain-language reasons. Any stock's rank can be looked up. |
| Evidence scorecard | scorecard | 0–100 per dimension, with cited evidence, positives and risks. Each dimension shows whether history tests found it useful, and only tested dimensions count toward the total. |
Research and the quant lab
| Command | What you get | |
|---|---|---|
| Research | research | Event studies and cost-aware backtests: does any of this predict returns? |
| Policy signals | policy | 新闻联播 since 2016, read for industry policy: stance and strength on the wording ladder (研究 → 稳步推进 → 加快 → 大力支持). |
| Quant lab | lab | Backtest any idea described as a small spec (earnings, 业绩预告, policy signals, factors) on point-in-time history, with an illustrated report. The last 2 years are locked until you confirm once, and every variant you try raises the bar for significance. |
Your portfolio, and AI agents
| Command | What you get | |
|---|---|---|
| Portfolio check-up | portfolio | Your holdings on real price history: concentration, holdings that secretly move together, where the risk comes from, and replays of the 2015 / 2018 / 2020 / 2021–22 / 2024 crashes on today's weights. |
| AI agents | mcp | 40 MCP tools (DeepSeek Harness plugin in dsh-plugin/; Claude and Cursor work too). Every feature above can be asked in plain words ("what can you do?" lists them), and the agent can do research it can't do alone: run backtests on real data, screen 5,000 stocks, check your portfolio. |
New in 0.4: from reading to acting, with a record
| Command | What you get | |
|---|---|---|
| Ask in one sentence | ask | Type what you want ("茅台为什么跌", "backtest buying after big beats", "buy 100 600519 in my paper account") and it runs the matching feature. |
| Charts · click a day | dashboard, day | Candles, moving averages, MACD/RSI/KDJ and support/resistance zones. Click any candle to see that day's move, volume, news and filings. breakouts scans for breakouts. |
| Smart-money map | moneymap | 43 quarters of top-10 holders: national team (汇金/证金/国新), social security and pensions, northbound, insurance, QFII, funds. Exits the disclosures hide are inferred. Daily ETF creations flag likely rescue buying. Also on each stock's page. |
| AI research team | team | Five analysts (fundamentals, technicals, news, smart money, risk) debate; a portfolio manager decides, with a price plan. Every claim cites evidence. Each call is logged and scored after its horizon, so the team has a public track record. |
| Paper trading | paper | A-share, HK and US accounts with real frictions: next-open fills, limit-up/down, 5%-of-volume cap, T+1, lots, commission (min 5 yuan), stamp duty. Accounts can follow a lab strategy, the forecaster or the long-term plan, and are rebalanced automatically each night. Records can't be edited or deleted. |
| Price alerts | alerts | Support/resistance breaks, the team's entry/stop/target levels and paper fills, checked on trading days (A-share exchange calendar, US holiday rules, HK fixed-date holidays; HK lunar-calendar holidays not yet) or live while the dashboard is open. |
| 3–12 month forecast | forecast | Ranks all A-shares on momentum, volatility, growth, ROE, margins and value, refit monthly on past data only. Shows its own test status next to every number (see below). |
| Long-term plan | plan | A risk profile (A-shares + bonds + gold + US, or a USD version), this month's buy list with valuation-tilted amounts, yearly rebalancing, and 20 years of history from four bad start dates. |
| Share cards | card | An image of a team call, a paper account or a lab result, with its record on it. |
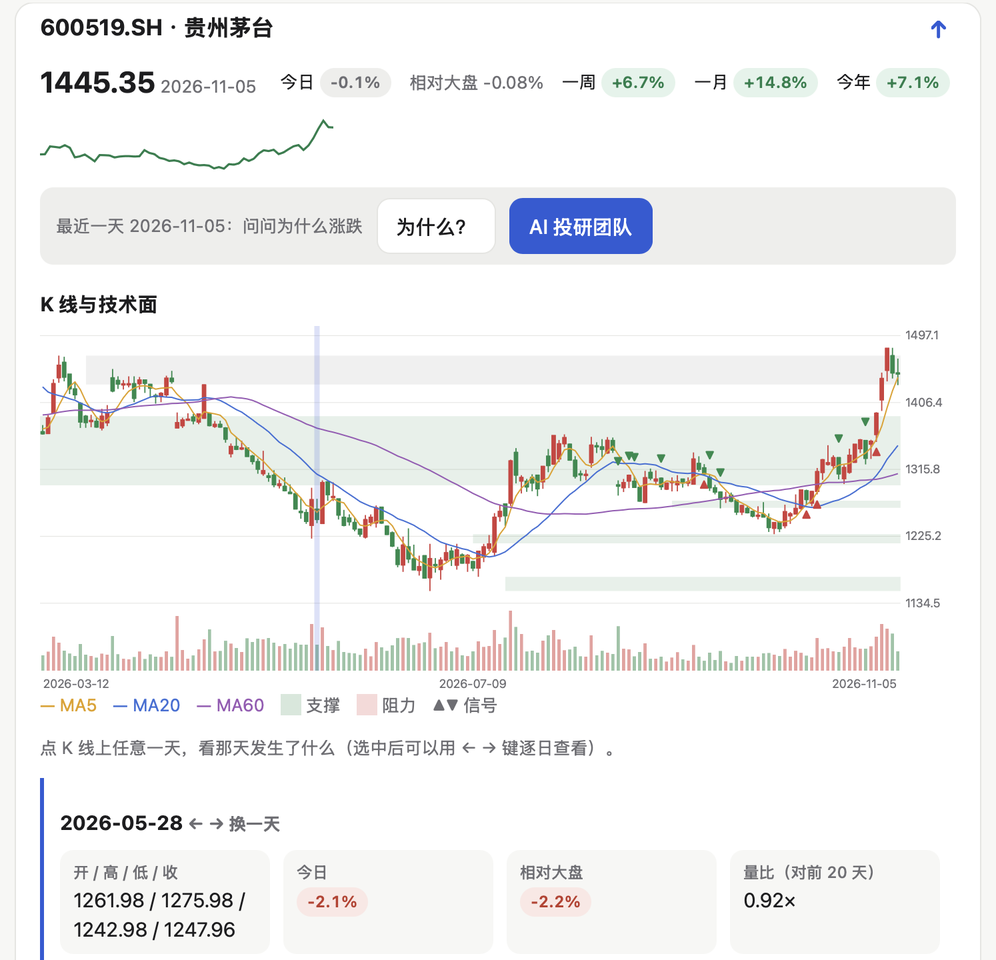
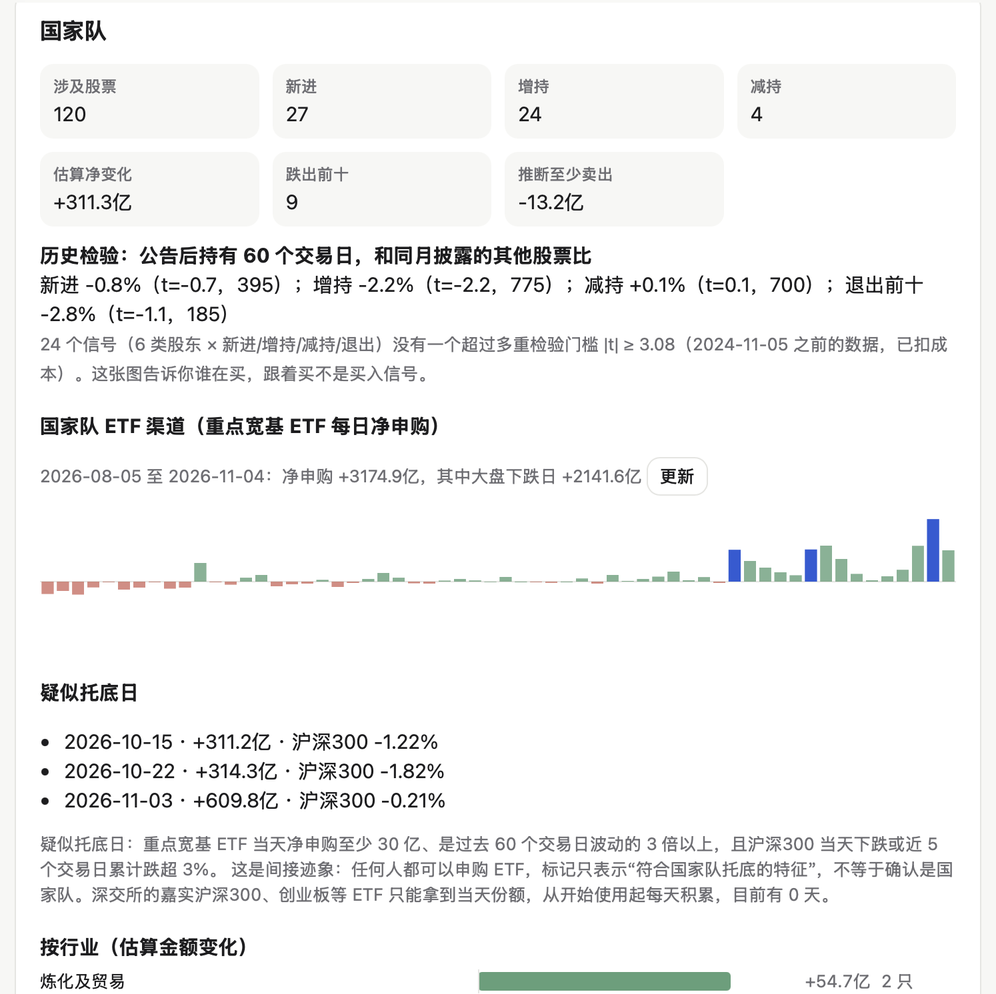
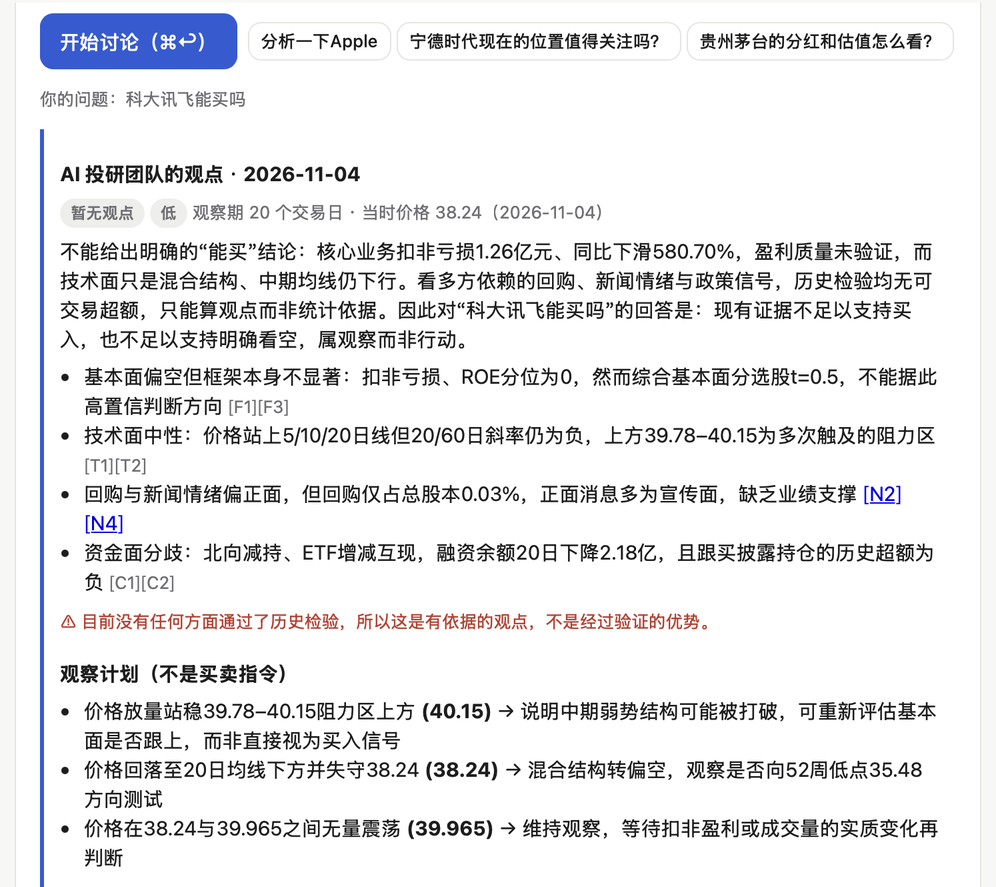
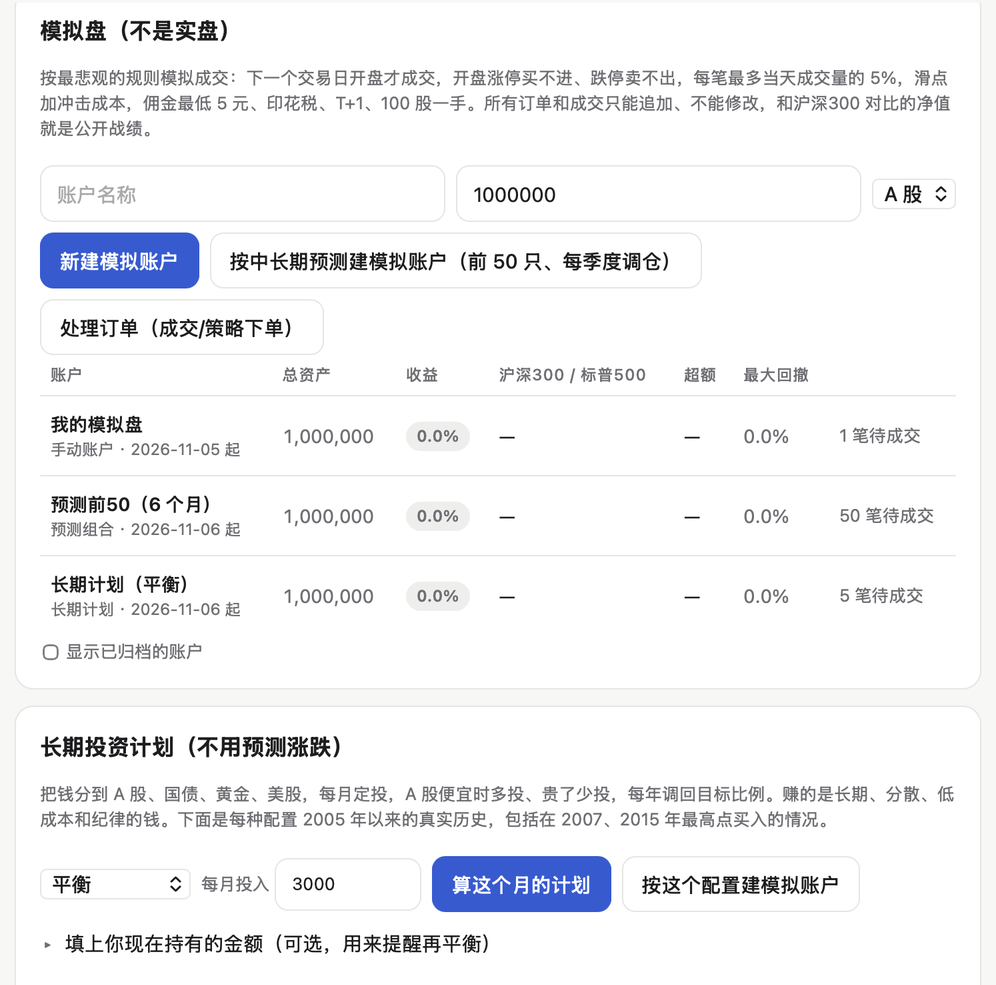
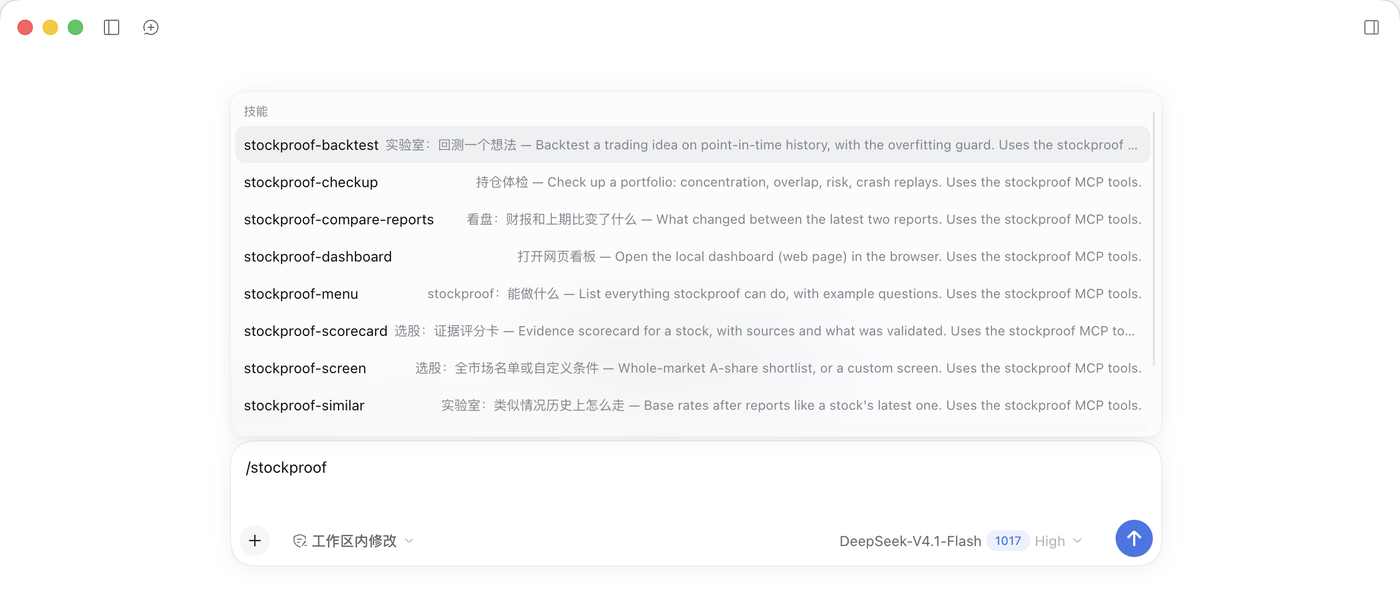
Everything runs in one local web page (stockproof dashboard). The Home tab shows what you can do, with clickable examples; the Lab tab backtests ideas from a form, no JSON needed; the Portfolio tab checks up your holdings and remembers them for next time. The first time you use stockproof in DeepSeek Harness, the agent lists everything it can do and suggests trying the dashboard; after that, ask "what can you do?", type /stockproof for ready-made requests, or say "open the dashboard". Say "open the dashboard's lab tab" to jump to a page. Running stockproof with no arguments prints the same grouped menu, and in DeepSeek Harness typing / lists ready-made prompts (check up a portfolio, backtest an idea, why did it move…).
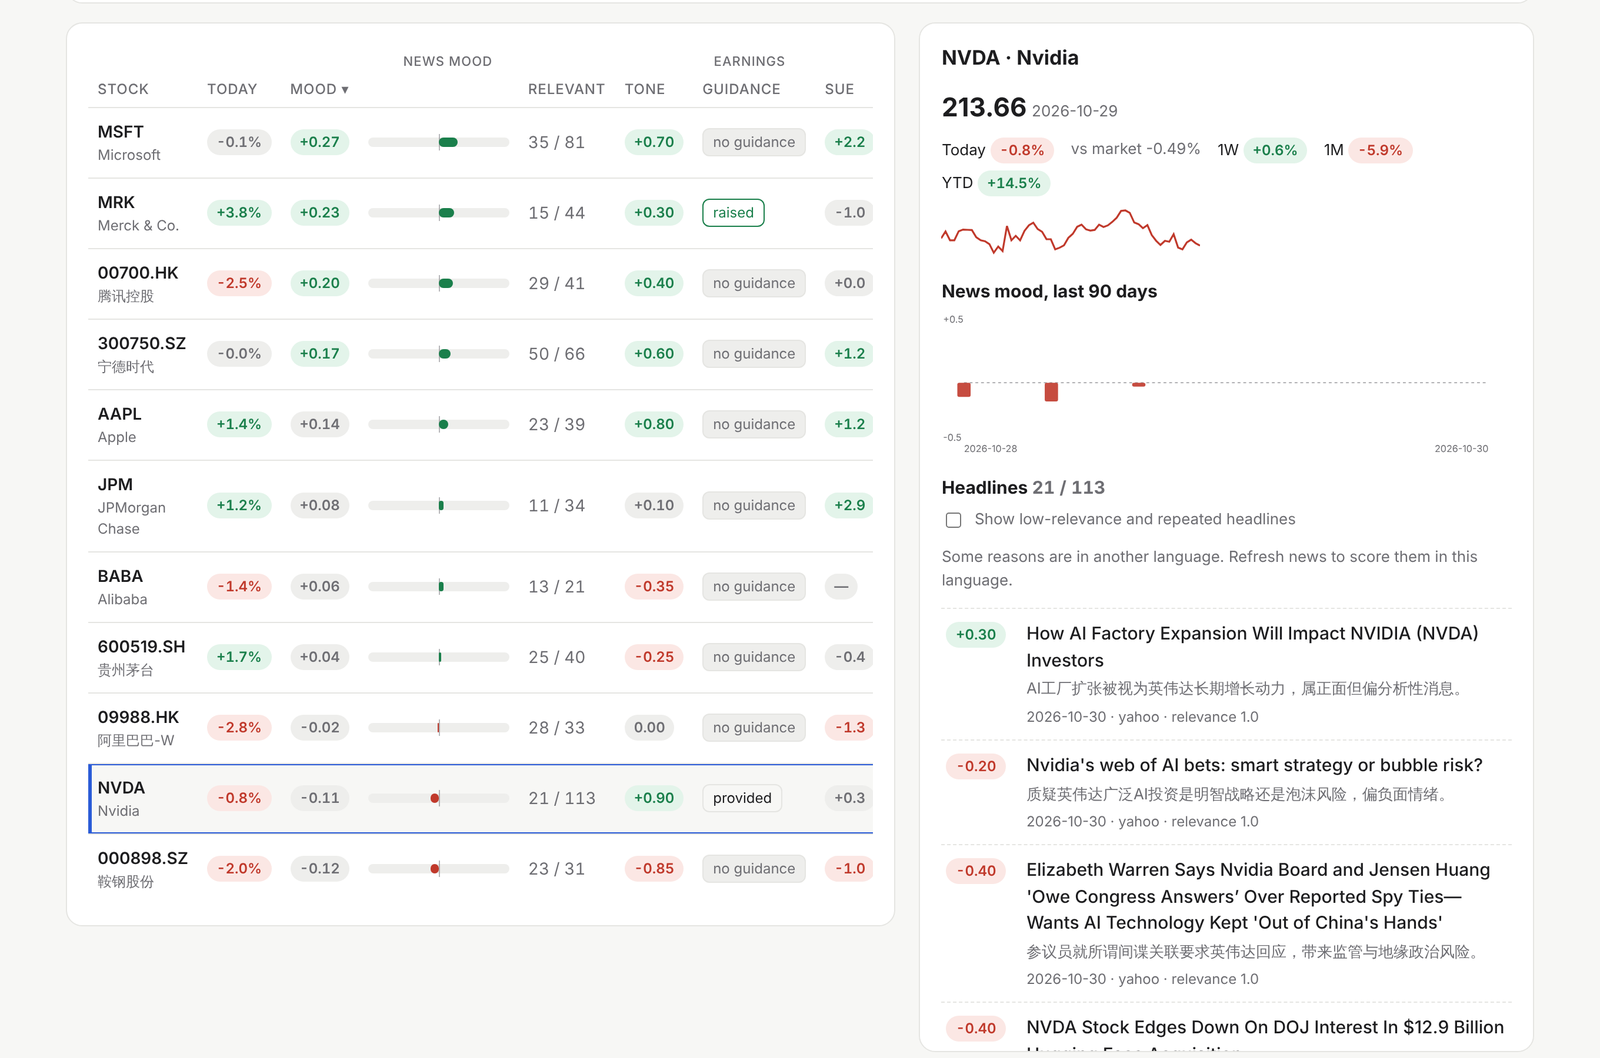
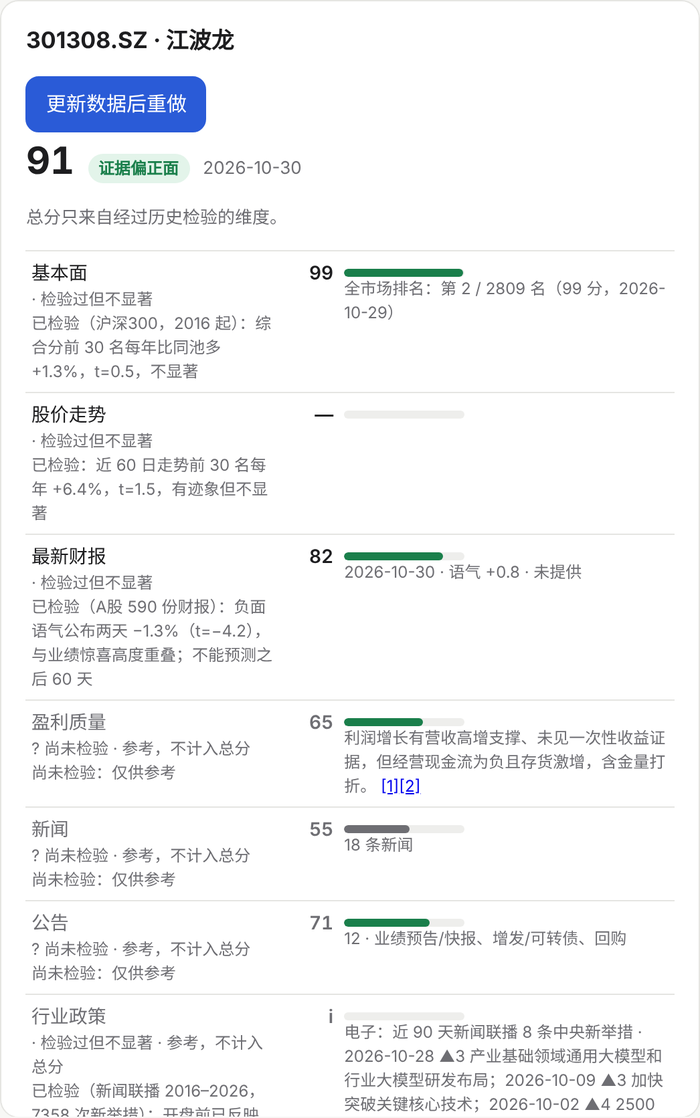
What an LLM can't do alone — and can with stockproof
Ask DeepSeek Harness "A 股业绩大超预期的公司,财报公布后第二天买入持有 20 天,扣费后能跑赢吗?". The model turns the question into a spec, the lab runs it on ten years of point-in-time A-share data, and a report opens in your browser. The answer was no: −3.6% a year (t = −2.0), positive in 3 of 4 years before 2020 and negative every year from 2020 to 2024. Ask for a variant and the agent reports that the significance bar went up with the number of tries.
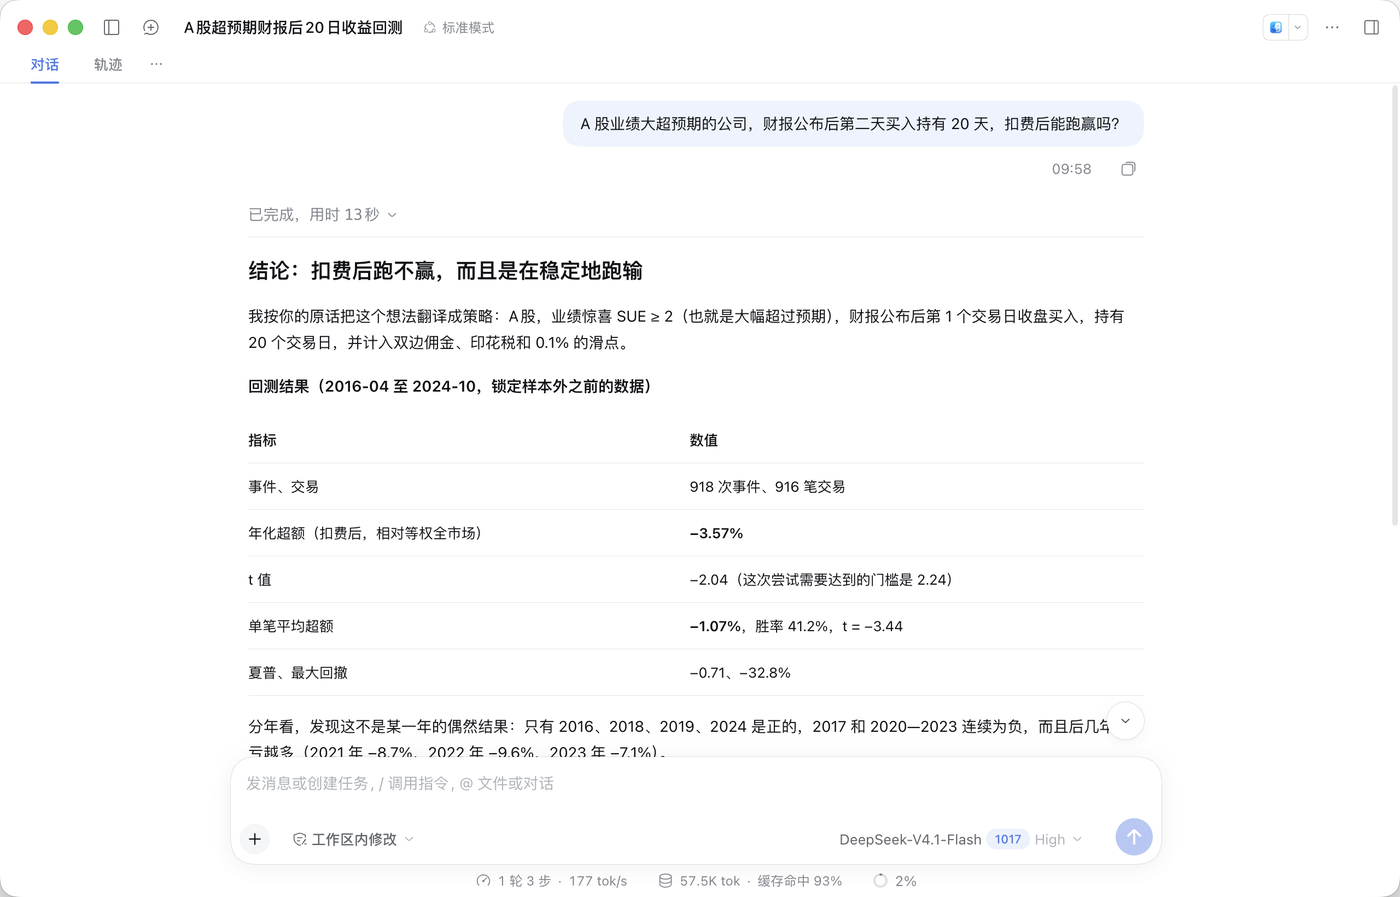
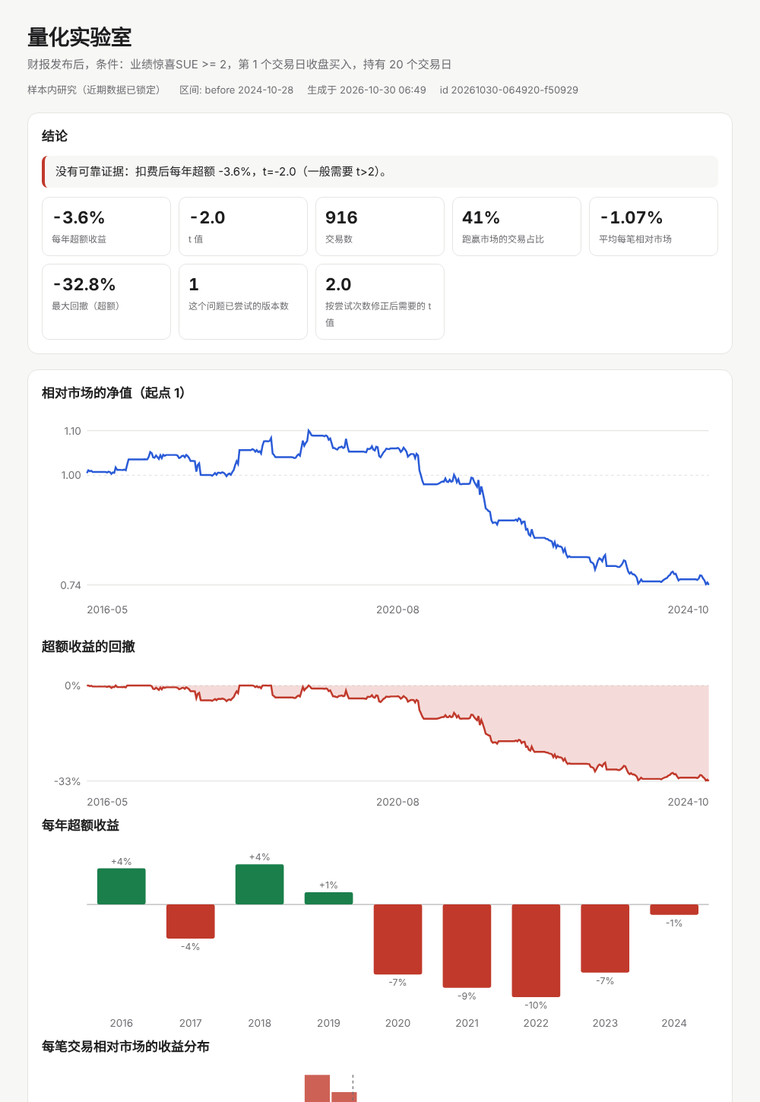
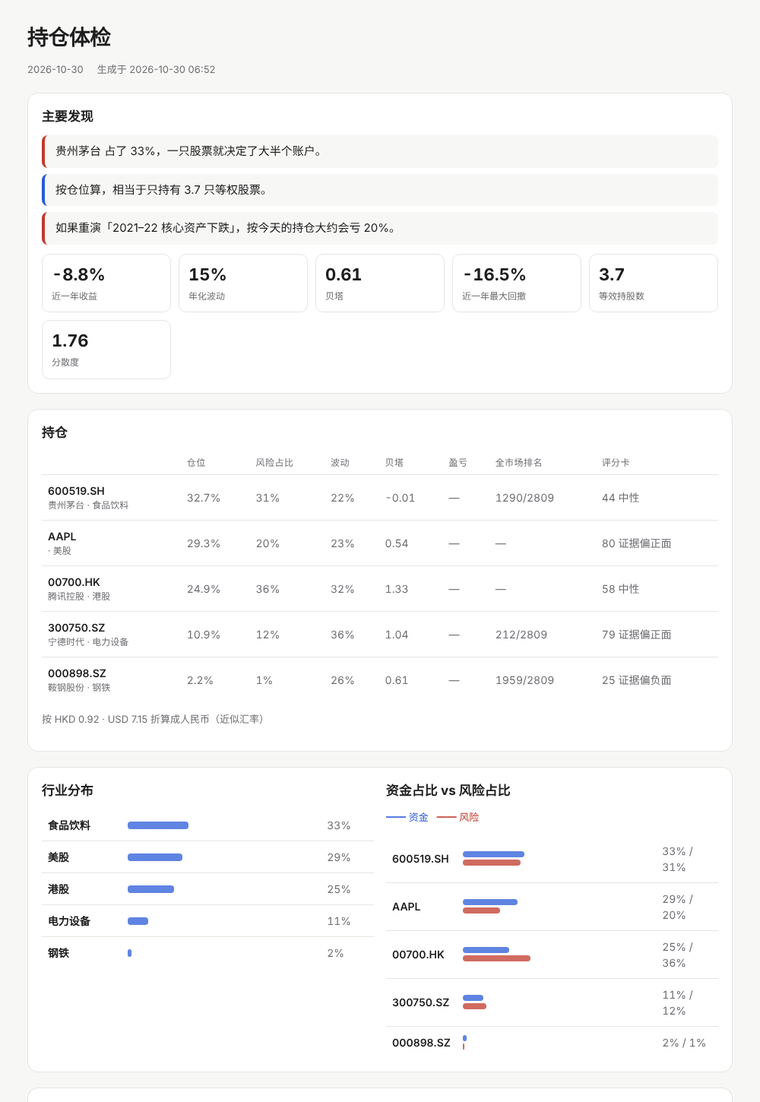
In DeepSeek Harness, type /stockproof for ten ready-made requests:
What the research found
Run on the author's data (2005–2026). Each result is a click away in the Research tab, with t-statistics and caveats.
| Question | Answer |
|---|---|
| Do prices react to earnings surprises? | Yes, on the day. Good minus bad SUE: US large caps +1.7% (t = 5.4), CSI 300 +2.0% (t = 17.4). Dated by the 10-Q or legal deadline instead, the reaction is gone, so the real date matters. |
| Does the LLM's reading add anything? | Yes, for the reaction. On 472 US releases, tone explains the day's move where SUE does not (tone t = 3.1, SUE t = −0.5; R² 0.004 → 0.035). A-shares: negative tone −1.3% (t = −4.2). |
| …and does it predict what happens next? | No. Tone does not predict days 2–61 (t = 0.6). |
| Post-earnings drift? | Gone in US large caps since 2021. Still present in A-shares (+2.2%, t = 2.5), but long-only it earns +0.3%/yr after costs (t = 0.2): the drift sits on the short side, which A-share investors can hardly trade. |
| Does a fundamentals screen beat the market? | No. Top 30 by the composite score: +1.3%/yr vs the same universe (t = 0.5). Momentum alone: +6.4%/yr (t = 1.5, not significant). |
| Does 新闻联播 policy wording predict industry returns? | Not tradably. Over 8,490 new central measures, the strength of the wording is priced in before the open (+0.03%, t = 5.3; strongest level +0.12%). Afterwards, supported industries do slightly worse. Backtest: +0.6%/yr (t = 0.4). |
| Does following the national team / pension fund pay? | No. Against other stocks disclosed the same month, none of 24 signals (new, add, reduce, exit × six holder kinds) clears the multiple-testing bar at 60, 120 or 250 days. The disclosure comes 1–4 months late. | | Can we predict next quarter's national-team buys? | Yes, but it doesn't pay. Top-20 picks are hit 2.1× the base rate (AUC 0.64); buying them before the reports earns −0.3% a quarter after costs. | | Can 3–12 month returns be predicted? | They could, until recently. On 20 years of whole-market data (5,224 stocks incl. delisted), the top 10% beat the average stock by +6.7%/yr after costs at 6 months (t 2.8). In the locked 2024-11→2026 years it lost: low-volatility and value stopped working in the post-September-2024 rally. The app labels it "passed historically, failed in the last two years". | | What does work for a long-term investor? | Diversifying. Balanced plan (A-shares, bonds, gold, US) started at the 2007 top: +6.7%/yr, worst drop −30%. CSI 300 alone from the same day: −1.7%/yr, −71%. |
The pattern holds across all of these: public information is priced fast. So stockproof helps you read and check evidence faster, and every forecast it shows carries its own test result. It does not place real orders: you can practise on paper accounts, and anything real is your decision.
Principles
- Cited, not invented. The LLM may only use the numbered items it is given. Uncited points are dropped, and "unexplained" is an allowed answer.
- Scores carry their track record. ✓ useful in tests · tested, not significant · ? not tested yet.
- Point-in-time. EPS as first reported, real announcement dates, entry after the news. No peeking ahead.
- Any LLM. DeepSeek (default), OpenAI, Qwen, a local Ollama model, or any OpenAI-compatible API. Each item is read once and cached in SQLite, so daily use costs cents.
- No paid data. SEC EDGAR, Yahoo/Google News RSS, Nasdaq, and Eastmoney / Sina / CCTV / Shenwan via AKShare.
- Local and private. The dashboard listens on 127.0.0.1 only and refuses requests from other websites. API keys are read from the environment and never written to disk.
Install
Python 3.10+ (3.11+ for China markets).
Works on macOS, Windows and Linux (tested on all three in CI).
pip install "stockproof[cn,mcp]"
Then give it an API key (DeepSeek by default; stockproof providers lists the others). US earnings also need a
contact for the SEC.
macOS / Linux — add to ~/.zshrc (or ~/.bashrc) so it is kept, then open a new terminal:
export DEEPSEEK_API_KEY="sk-..."
export STOCKPROOF_SEC_CONTACT="Your Name you@example.com"
Windows — in PowerShell (saved for your user; open a new window afterwards):
setx DEEPSEEK_API_KEY "sk-..."
setx STOCKPROOF_SEC_CONTACT "Your Name you@example.com"
Then start the dashboard:
stockproof dashboard
Add stocks in the page (AAPL, 600519, 300750, 00700 …) and click Refresh news / Refresh earnings.
10-minute tour
After installing and setting your API key:
- Look around the demo (2 min).
stockproof demo, then open each tab. The Home tab shows what you can do, with examples to click. - Your own stocks (3 min).
stockproof dashboard→ Stocks tab → type a few codes (AAPL, 600519, 00700) → Add → Refresh news, then Refresh earnings. The first refresh takes about a minute per stock. Click a row for its news, earnings read and announcements; click Why? next to an unusual move. - Test an idea (2 min). Lab tab → click a template, e.g. "Buy after big earnings beats, hold 20 days" → Backtest. Read the verdict, then change a condition and run it again: the significance bar goes up with each variant you try.
- Check your portfolio (1 min). Portfolio check-up tab → type your holdings (
600519 100, AAPL 50) → Check my portfolio. The report shows concentration, holdings that move together and how today's weights did in past crashes. - Ask in plain words (1 min, optional).
stockproof mcp --install-dsh, restart DeepSeek Harness, type/stockproofor ask "what can you do?". - Keep it up to date (1 min).
stockproof schedule --time 21:00refreshes your watchlist every evening and writes the daily digest (macOS, Windows, Linux).
Commands
stockproof dashboard                         # everything in one local page
stockproof scan AAPL 600519 00700 --lang zh  # news mood report
stockproof earnings AAPL MSFT --open         # latest releases read by the LLM, with SUE
stockproof screen --top 30                   # whole-market A-share screen
stockproof screen --backtest --skip-screen   # test the screening rule on history
stockproof scorecard                         # evidence cards for the screen's top 10
stockproof scorecard 600519 NVDA             # …or for any stocks
stockproof research --market cn --open       # earnings event study + backtest (us / cn)
stockproof policy                            # 新闻联播 policy study (first run: a few hours of downloads)
stockproof daily                             # one refresh of the watchlist + daily digest
stockproof schedule --time 21:00             # run `daily` every evening (macOS, Windows, Linux)
stockproof calendar                          # who reports in the next two weeks
stockproof mcp --install-dsh                 # add to DeepSeek Harness on this computer (desktop app too)
stockproof lab caps                          # quant lab: what can be tested here
stockproof lab run '{"type":"earnings","filters":[{"field":"sue","op":">=","value":2}],"hold_days":20}' --open
stockproof lab confirm <id>                  # one shot on the locked holdout
stockproof portfolio "600519 100, 00700 300, AAPL 50"   # portfolio check-up
stockproof demo                              # offline demo, no key
stockproof ask "茅台为什么跌"                # one sentence → the matching feature
stockproof team 600519                       # AI research team's call (--record for the track record)
stockproof day 600519 2024-09-30             # what happened on one day
stockproof moneymap --ticker 600519          # who holds it: national team, pensions, northbound…
stockproof moneymap --research               # does following them pay?
stockproof forecast 600519                   # 3/6/12-month forecast with its test status
stockproof plan --profile balanced --monthly 5000   # long-term plan: this month's buys
stockproof paper new --name "My paper" --cash 100000 # paper account (--market cn/hk/us)
stockproof paper buy <account> 600519 --shares 100
stockproof paper forecast --horizon 6m --n 50        # account that follows the forecaster
stockproof paper show <account>              # positions, P&L vs benchmark, trade log
stockproof alerts                            # price alerts (--watch to keep checking)
stockproof card team <call_id> --open        # share card
Chinese codes can be typed in any common form: 600519, 600519.SS, 300750, 920001, 700, 0700.HK.
How the pieces work
News relevance
A feed for MRK also returns stories about the German Merck KGaA, a feed for GE returns GE HealthCare news, and NVDA appears in every "stock market today" article (in one scan only 2 of 14 headlines were really about Nvidia). The model gives each headline a relevance score (0–1) and a sentiment score (−1 to +1), with a reason. Off-topic stories stay visible but are not counted. When several headlines cover the same event, the model marks them as duplicates, so the event counts once.
Earnings and SUE
SUE = (this quarter's EPS − the same quarter last year) / standard deviation of the previous 8 such changes, using EPS as first reported. US quarters come from SEC XBRL, and Q4 = full year − Q1–Q3. A-share reports are year-to-date totals, so single quarters are derived by subtraction. Announcement dates come from the 8-K Item 2.02 filing (after 16:00 New York time counts as the next day) or from Eastmoney's 预约披露 actual disclosure date.
Screen and scorecard
- Screen: fundamentals for all ~5,200 A-shares come from Eastmoney's 业绩报表 tables (one download per report period).
- Filters: no ST stocks, market value ≥ 50亿, at least 2 years listed.
- Score: the average percentile of five factors.
- Scorecard: six dimensions plus industry policy, with one LLM call per stock per day.
- Earnings quality asks whether growth comes from the core business and is backed by cash, or from one-offs.
- Announcements count each kind of event once, since one buyback can produce ten filings.
Backtests
- Entry and holding: entry at the close after the reaction (earnings) or at the next open (policy), with capital split into slots and empty slots holding the market.
- A-share costs and trading rules:
- Commission 0.025% per side, slippage 0.1% per side.
- Stamp duty on sales: 0.1%, or 0.05% from 2023-08-28.
- Price limits are respected, at 10% / 20% / 30% depending on the board.
- Benchmark: the equal-weighted average of the stocks studied, because today's CSI 300 members beat the index by 13% a year (survivorship).
Data sources and limits
- Sources: SEC EDGAR, Nasdaq, Yahoo/Google News RSS, and Eastmoney, Sina, CCTV and Shenwan via AKShare.
- These are free, public, unofficial endpoints. They can change or rate-limit you.
- stockproof slows down, retries, and stops with a clear message when a source refuses.
tools/*_probe.pychecks which sources work from your network.
- LLM errors: models can misread. Every point links to the original, so check it.
- Paper is not live. Fills assume next-open prices and a volume cap; real fills can be worse, and the gap view
(
stockproof paper gap) compares paper with the backtest. HK lot sizes are assumed to be 100 shares. - The forecaster is decaying. It passed 2010–24 and failed in the locked 2024-11→2026 years. The US forecaster (60 large caps, price features only) passes nothing.
- Not investment advice. There is no broker connection and no automatic real-money trading.
Development
pip install -e ".[dev,mcp]"
pytest              # ~280 offline tests: fake feeds, fake LLM, fake AKShare; no key or network needed
python tools/make_demo.py   # rebuild the demo bundle from your own stockproof_data
MIT License.
Plugins relacionados
archify (deepseek-harness)
tt-a1i/archify
next-ai-draw-io (dsh-plugin)
dayuanjiang/next-ai-draw-io
WeKnora (dsh-weknora)
tencent/weknora
weknora
tencent/weknora